Looking at Salesforce data in Tableau can be tricky. Pulling together a full data-rich picture requires the technical knowledge to correctly join data from Salesforce Opportunities, Accounts, Users, Contacts and Leads. In its release of Tableau Online 2018.1, Tableau introduced a clever solution to this problem, providing seven Dashboard “Starters” for Salesforce:
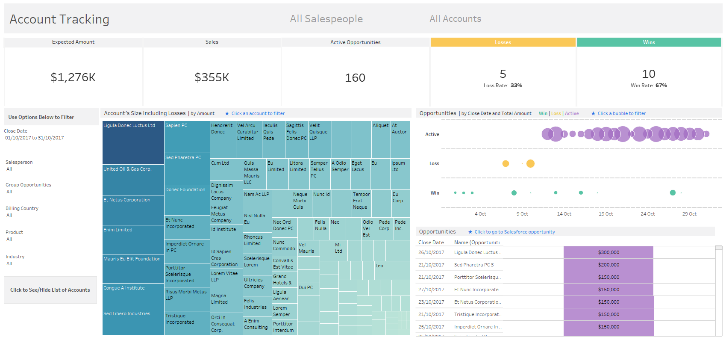
- Account Tracking
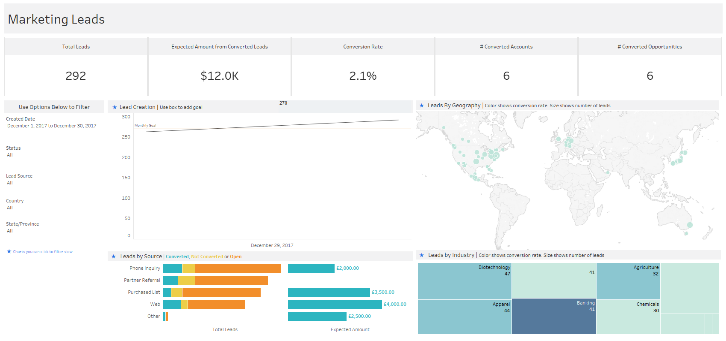
- Marketing Leads
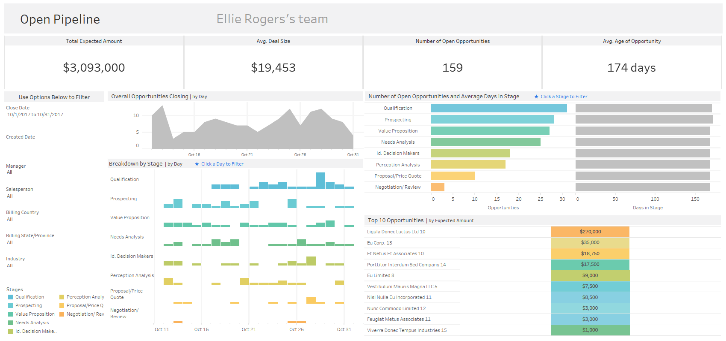
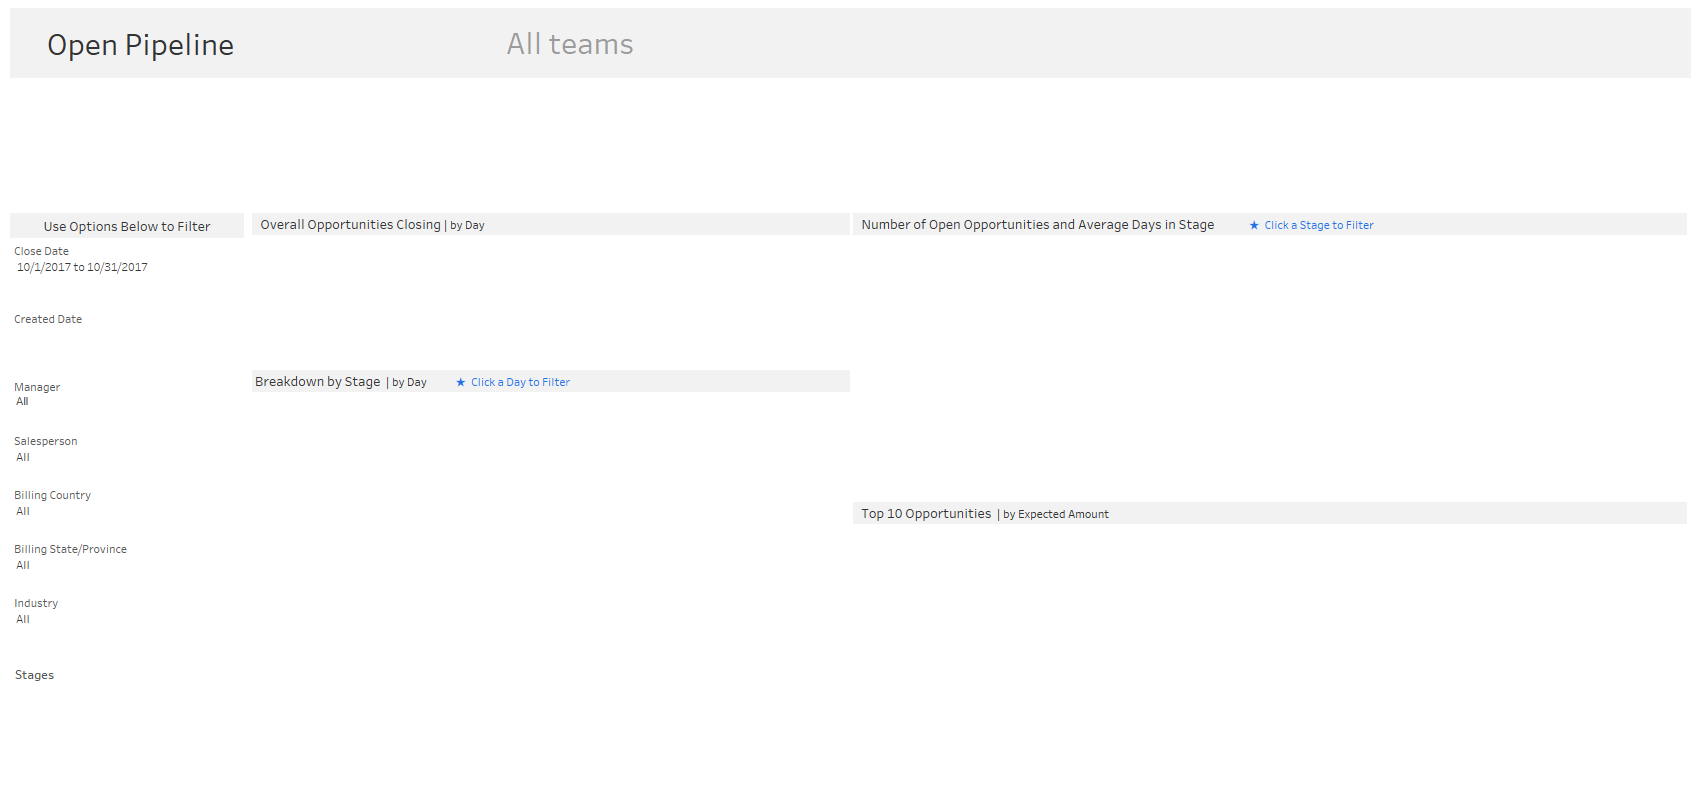
- Open Pipeline
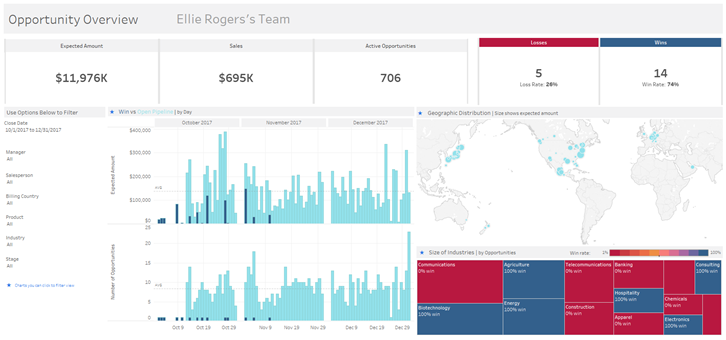
- Opportunity Overview
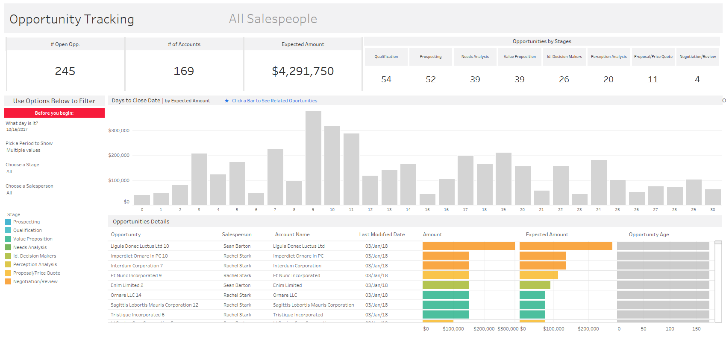
- Opportunity Tracking
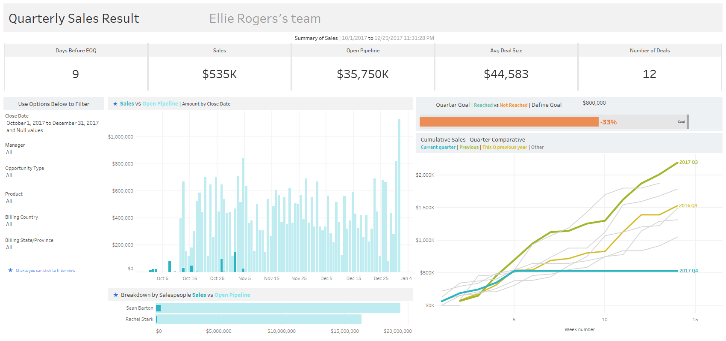
- Quarterly Sales Result
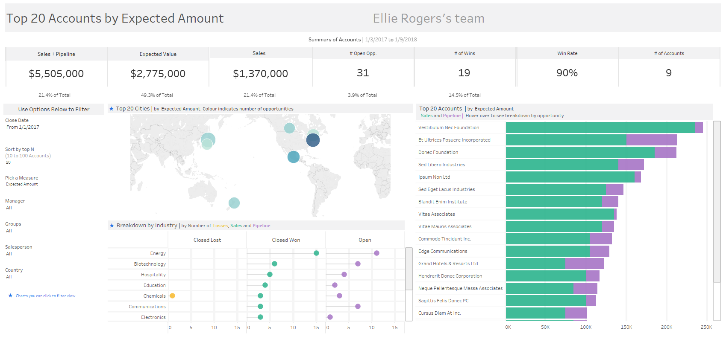
- Top Accounts
We immediately put the Salesforce Dashboard Starters through their paces to see if they were a viable option for us and our customers. What we discovered is that while the idea of the Salesforce Starters is great, the execution was not up to snuff.
For example, while the Starters look great with demo data some didn’t work properly when connected to our real data and we got some blank worksheets.
Sometimes there was an easy fix to the problem; in other cases not so much. In the end, however, we decided that once the handful of issues are resolved these pre-built dashboards will provide a good starting point for visualizing Salesforce data in Tableau.
Following are the lessons we learned during our deep dive into Tableau’s Salesforce Dashboard Starters. Although you may not encounter all of the issues we describe, this information should help get you up and running as quickly and painlessly as possible.
UPDATE: September 2018 – We shared our findings with Tableau and some of the issues have been resolved. Be sure to download current versions of the Dashboard Starters to get the all of the “fixes.”

Dashboard Starters for Salesforce: 18 lessons learned
- Tableau Dashboard Starters for Salesforce are available in Tableau Online (version 2018) if you have the Creator License. You will see them as options when you create a New Workbook. If you don’t have Tableau Online they are also available for download. NOTE: Dashboard Starters on the download site are not as up-to-date (with fixes) as the Dashboard Starters in Tableau Online.
- Dashboard Starters are written in Tableau 2018.1, which can be a problem if your Tableau Desktop users are on 10. Get around this by using the new “Export as Version” feature.
- Dashboard Starters only work with Tableau extracts (they use Tableau’s Salesforce Cloud Connector). As a result, they take a while to open because they are building the extract (we experienced waits of 5-30 minutes). This data is static and must be refreshed periodically.
- Custom fields need to be added manually.
- Performance can be unacceptable and can’t be tuned easily. If the source data came from a database instead of a Tableau data extract, performance could be improved by using database functionality like indexed tables, materialized views, summary tables, etc.
- Swapping out Tableau’s Salesforce Cloud connector for a local Salesforce reporting database can be difficult. Problems arose due to datatype mismatch and different column names. We especially noticed problems when dealing with Boolean datatypes.
- When opening Dashboard Starters, Tableau will build an extract using all of your Salesforce data. Unfortunately, you can’t use extract filters to limit the data retrieved to the most recent years.
- Many of the tables in Salesforce use the same column names (i.e. CreatedDate and ID). Therefore, it’s easy to make a mistake when choosing the correct fields. We found such a mistake in the Open Pipeline Dashboard Starter. In this workbook, the “Created Date” field used to calculate the Age of Opportunity comes from the User table (aka Owned By table). Done this way, all of the opportunities for a particular Sales Representative will have the same Age of Opportunity, which is incorrect. The correct field is “CreatedDate” from the Opportunity table. NOTE: This is a significant error. We have notified Tableau and hopefully, it will be fixed soon. UPDATE 09-19-2018: In Tableau Online’s Age of Opportunity calculation, the Created Date now comes from the Opportunity table, which is correct.
- Many important fields were hidden (i.e. CreatedDate in the Opportunity table). Unhiding fields requires rebuilding the extract. NOTE: We realize this behavior is normal and expected when using Tableau data extracts. Hiding fields makes the extracts smaller, which can be a good thing, but it is time consuming and painful to rebuild extracts every time you unhide a field.
- In the Open Pipeline Dashboard Starter, the data model contains both Opportunities and Opportunity History. While you may need the level of detail provided in the Opportunity History table, be aware that joining data in this way can cause data duplication and result in incorrect numbers when summarizing measures.
- The default ranges of the default filters may exclude most of your values (i.e. the date filters had upper limits that defaulted to 2017 in many cases).
- Once you bring your Salesforce data into Tableau, data integrity issues become apparent. Your maps may not build properly. City, state and country information may have been entered without data validation in your Salesforce instance. Hence, country abbreviations can be inconsistent (e.g. U.S. or United States or USA). This can lead to problems when trying to visualize Sales by Country. You can get around this issue by creating a calculated field or by using Groups in Tableau. We found it is better to fix this issue at the source.
- Ideally, data integrity issues (see 12 above) are resolved on the back end using something like Tableau Prep. Unfortunately, Tableau Prep 2018.1 cannot use the Salesforce Cloud Connector. For more details on Tableau Prep, read Tableau Prep – 10 Favorite Features. If you have a SQL Server database of Salesforce data, Tableau Prep can be used.
- If you are publishing more than one Salesforce Dashboard, each dashboard may require its own extract. For example, all of the “Opportunity” Dashboard Starters use Opportunities (Salesforce) as the data source but in reality, they all have different tables, and hidden fields. If you publish and overwrite Opportunities (Salesforce) it may “break” previously published Starters.
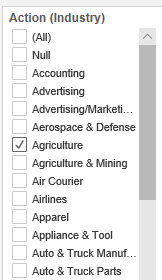
- Top Accounts had blank worksheets and missing data. This was because a default Action Filter had Industry set to Agriculture (you may have different values). Doing so excluded most of our data and caused some of our worksheets to be blank. Once we changed the Industry action filter to All and applied the filter to all the worksheets on the dashboard, we got the data we expected.

- You can’t use the Data Grid in the Data Source Tab. This makes it difficult to validate data.
- There were some inconsistencies with default formats for dates and currency. Some currencies were set to Euros (Open Pipeline). Some dates appeared in the European format Day/Month/Year.
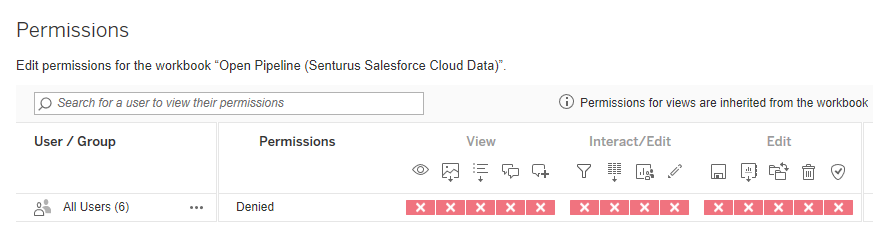
- By default, users do not have permission to view the workbooks. To distribute/share these you need to modify the permissions. See below:

At Senturus, we have been using Salesforce for 15 years and we have been a Tableau partner since 2014. We pride ourselves on helping our customers gain valuable insights from Salesforce data using Tableau. And we like to note that we “eat our own dogfood”…in other words we also use Tableau and Salesforce internally to make better business decisions. The insights we share here are lessons we learned through our own first-hand experience. By sharing them, we hope to get you up running with the Tableau’s Salesforce Dashboard Starters as quickly as possible.
If you find using these Dashboard Starters with Tableau’s Salesforce Cloud Connector is unmanageable, contact us. We can offer a better architected solution that stores Salesforce data in a database, allowing for more flexibility, better performance and alleviating the majority of the issues described here. We can also enrich Salesforce with data from other sources (i.e. Marketo), painting a complete picture of your company’s sales and marketing data. Whether you decide to use Tableau’s Dashboard Starters and just need help making them work or if you decide to use Salesforce from a reporting database (like we do), we are here to help you leverage Salesforce data in Tableau.
Additional resources
FYI: You can also embed Tableau Salesforce Dashboards inside the Salesforce Cloud. For more information on this topic see our on-demand webinar: Embedding Tableau in Salesforce Dashboards.
For more Salesforce Dashboard Starter tips, see the online help.
If you would like your Dashboard Starters to work with a “database” of Salesforce data, read our blog How to Get Around Extract Limitations in Salesforce. You may also be interested in our on-demand webinar about the lessons we learned using Dashboard Starters: Finishing What They Started: A Deep Dive into Tableau Dashboard Starters for Salesforce.