We share data prep tips you can do quickly in Tableau Desktop to ensure data is as “Tableau friendly” as possible. These 10 straightforward practices will help you produce better performing dashboards, avoid unnecessary calculated fields, and simplify the visualization building process.
In a perfect world, we recommend prepping data before it gets to Tableau Desktop. That way, data is organized once for all Tableau users, saving a massive amount of time and ensuring reliable, consistent numbers across all dashboards. But we get it, sometimes you just need to get a dashboard up on running ASAP. Like when you’re building a prototype. Or just want to point Tableau to an Excel file and start delving into ways to visualize using Tableau. These methods are perfect for these situations. Once you get done with your rush project, learn more about the benefits of data prep and modeling.
1. Try Data Interpreter
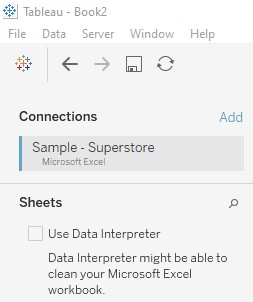
If your data is coming from Excel and has subtotals and extra data headers, Tableau Data Interpreter can clean that up for you automatically! It is as simple as checking the box next to Use Data Interpreter. Once you check the box, you can review the results and decide whether the steps taken are what you want.
See below:
2. Make sure dates are defined as Tableau dates
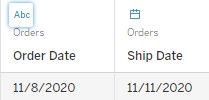
Look at the image below. Order Date is a defined a string, as denoted by the “Abc” icon. Ship Date is defined as a Tableau Date, as denoted by the calendar icon). Tableau is good at converting fields that look like month, day, and year to the Tableau Date format but sometimes, it will incorrectly define a date as a string (Abc).
If this is the case, click on the Abc icon and choose Date as the data type. It is important to do this step in the beginning because Tableau dates have a built-in hierarchy that makes it easy to drill up and down (Year > Quarter > Month > Day) by simply clicking on the + sign. In addition, visualizations such as continuous line charts will require a Tableau Date.

3. Make sure to define information such as country, city, state and zip/postal code as geographic data
Tableau is also good at automatically assigning data that looks like city, state or zip with the correct geographic role. But if you have field names that are not obvious (i.e. ST for state), Tableau may incorrectly assign another data type. It is important to have the geographic data correctly defined so that Tableau can visualize geographic data using a map.
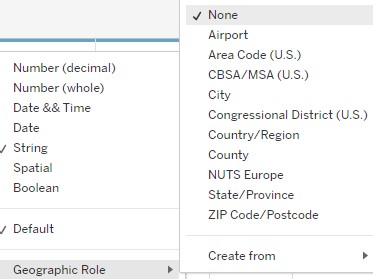
To know if your data is correctly assigned a geographic role, look for a small globe icon next to your data. If it is incorrectly assigned as a string (i.e. “Abc”) or numeric data type (i.e. “#”), assign it the proper geographic role: In the data source tab or in a worksheet, click on Geographic Role and choose the correct role. See below:
4. Make sure strings are defined as strings (denoted by Abc) and not measures (denoted by #)
Tableau will summarize measures or fields defined as numbers up to the level of detail on the worksheet. For numerical data that you do not want to summarize or add up (i.e. Order ID or invoice number), define these fields as a string (Abc). You can change the datatype from measure (#) to string in the data pane like you did for date and geographic data above. Or, you can go to a worksheet and drag the field from the measure section (listed at the bottom) to the Tables section at the top.
5. Don’t mix summary and detail data
If you have one column that contains both summary and detail data (i.e. YTD sales numbers mixed with monthly sales number), Tableau will add everything up and your totals could end up being incorrect. If you need to have summary data stored due to performance or other considerations, it is best to put totals in a separate column with a descriptive name. Tableau’s Level of Detail (LOD) calculations are a great way to create summary or total fields at a specific level of detail (i.e. “Total Sales by Region”). For more information on LOD calculations see our self-paced course.
6. Don’t have columns of months or years (i.e. Jan sales, Feb sales, March sales…)
Tableau does not add across columns by default. In order to get a total for these, you would need to create calculated fields. It is best to have one column for values and one for names.
If you have a spreadsheet with each month as a separate column, you can pivot your data in the Tableau data source tab (like you would in Excel). In this example, one column can be Month of Sales and one column can be Total Sales.
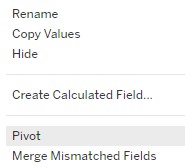
Structuring data in this way allows Tableau to do its job and add up the data properly. Perform pivots by selecting the relevant columns in the data source tab and clicking on the down triangle in the top right corner and selecting Pivot.
7. When necessary, group data
If data is entered as freeform text, you may have a variety of values that all mean the same thing. For instance, the abbreviations Ca, Calif and California all to indicate “California.” Group these types of like items under one umbrella.
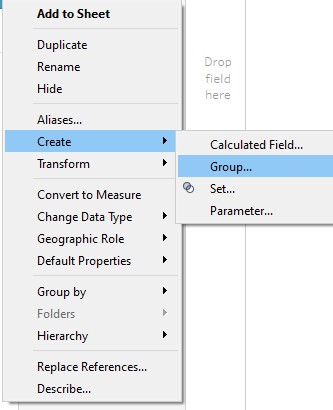
To group items, go to a worksheet and select the column then Create > Group.
NOTE: Tableau Prep is also a great way to group data. If you are ready to explore Tableau Prep and would like a little help, check out our self-paced Tableau Prep course.
8. Use data source filters to reduce the size of your data source
When opening a worksheet or dashboard, the first thing Tableau does is apply data source filters. Filtering data at this level is a great way to improve performance and enforce security (i.e. filter by user). Often, the data may go back for decades but only the recent data is relevant. The optimal time to filter out extraneous data is in the very beginning. That way every worksheet and dashboard using that data source will have better performance.
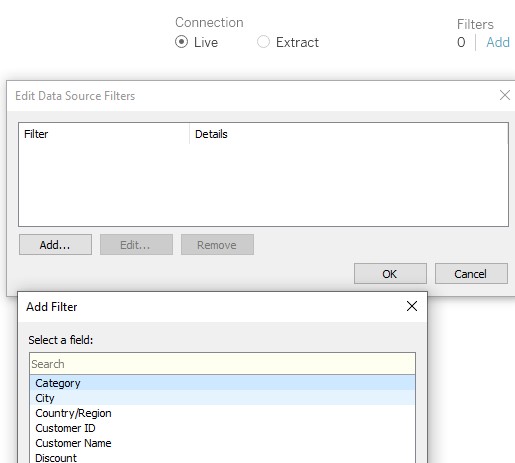
To create a data source filter, locate Filters at the top right of the data pane. Click Add then choose the column, i.e. “Order Date.” Then select last two years (or whatever is appropriate).
For more info on how to secure and filter data by user in Tableau, see our on-demand webinar by the same name.
9. If you are periodically loading new data (i.e. using Union for weekly, monthly loads) avoid adding new columns or changing format
Tableau expects all of the columns to match up when using a union. To facilitate periodic loads, keep the data files in the same format whenever possible (i.e. don’t add columns or change formats).
10. Make column names self-explanatory and intuitive
If your underlying data has fields with cryptic names, rename the fields/columns in the Tableau data source tab so that every worksheet or user has access to intuitive, user-friendly names. The goal of Tableau is to make it possible for anybody to explore and visualize data to gain insights. If field names are cryptic or redundant, surfacing insights is more difficult.
These tips are great for instances when time is of the essence and you just need to get a Tableau dashboard set up ASAP. However, we recommend doing most data prep upstream-before it even gets to Tableau. Having well organized, relevant data is key to nimble, accurate reporting. And it is especially important when you are combining disparate data sources.
Solid upstream data prep and modeling offers many benefits:
- Speeds ability to report on data and answer important business questions.
- Eliminates inaccuracies and discrepancies.
- Removes duplicative, error-prone and time intensive manual data prep efforts.
- Enables rapid self-service analytics through shared and certified data sets.
- Allows for complex KPIs that build off combined data points from multiple systems.
- Provides access to up-to-the minute information.
Contact Senturus to learn how we can help your organization build high performant data models that will speed self-service report development and accuracy.
Data Prep: Power BI vs. Cognos vs. Tableau (see on-demand webinar)