Last month, Microsoft officially added a great new feature to Power BI that really streamlines report building: field parameters! By allowing you to dynamically change what measures or dimensions are being used to filter a report, field parameters give you flexibility that results in less clutter.
For example, developers no longer have to create multiple instances of the same report in order to compensate for filtering on one differing measure or dimension. And the issues you get when you put multiple slicers on a page? Gone. No more having to worry about cross-filtering in the model, limiting the filters in use, using custom DAX. And, instead of having to create different versions of the same report for different time periods (annual, monthly quarterly, etc.), you can now have one report. Pretty nifty.
In this blog, we show you how to enable field parameters and build a report using a dynamic slicer.
You and your team can learn even more about Power BI in our private group and self-paced training courses.
Enabling Power BI field parameters
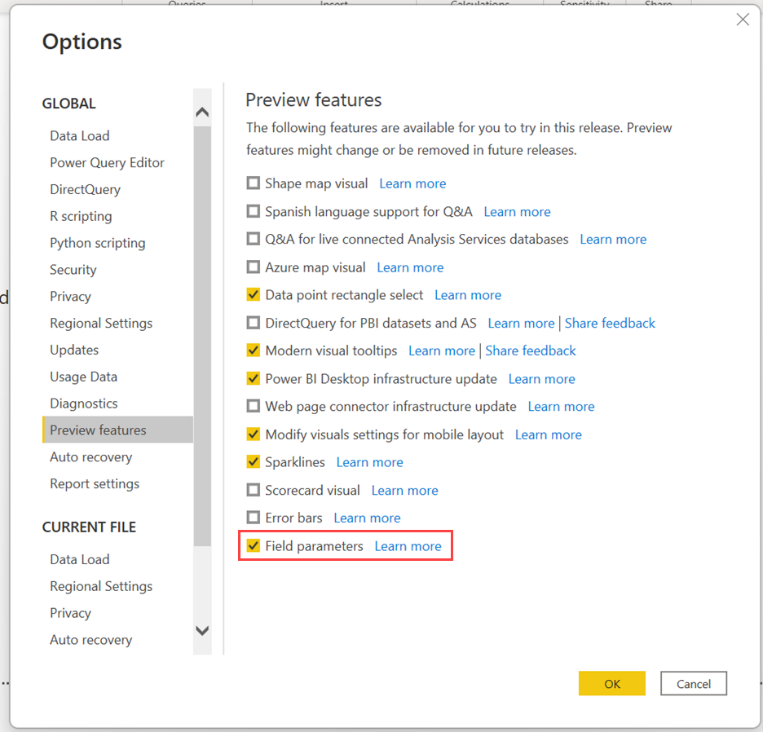
To set up field parameters, you must first enable the option.
Under the File menu, use Options and Settings ➔ Options ➔ Preview features. Select the Field parameters checkbox.

Adding Power BI field parameters
With the feature selected, we can now add in some field parameters.
Start by opening Power BI and bringing in your data. We will use a small sample of Adventure works data for our example. We’re going to build a visualization that allows a user the change between Country, Product Line and Region. In addition, we will let them choose the timeframe for the visualization.
We will begin by creating our field parameters.
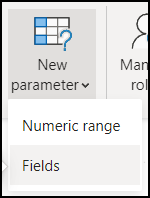
From the modeling tab, click New parameter ➔ Fields.
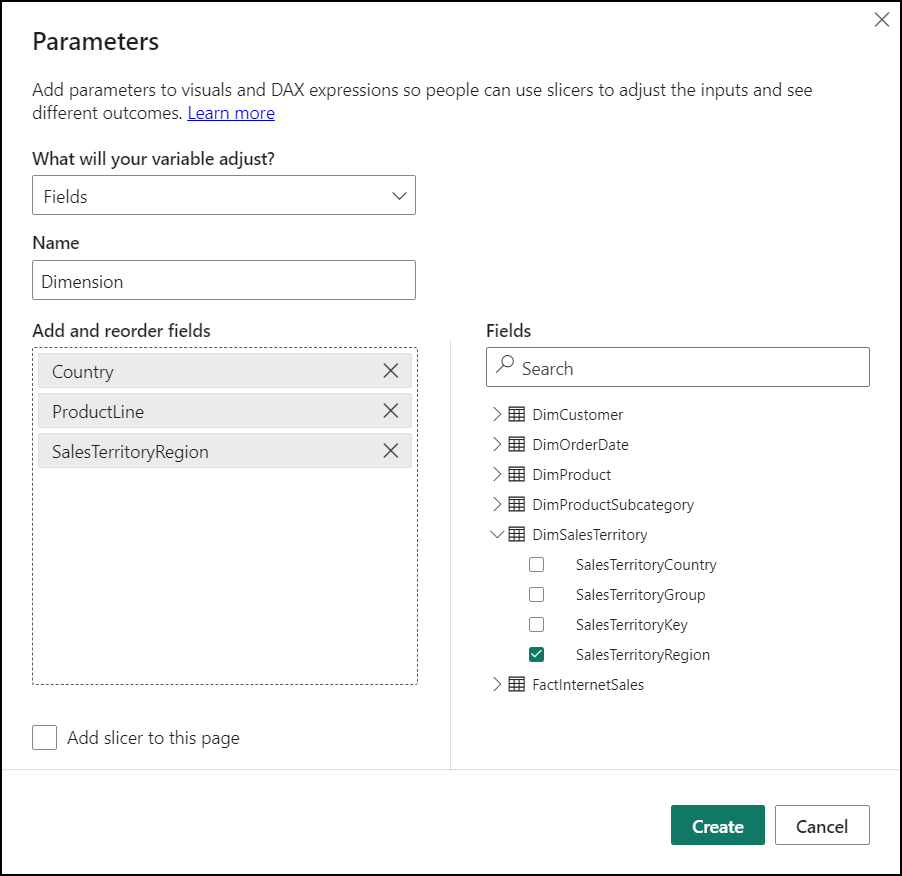
Give the new parameter a name. For this example, we used “Dimension.”
Then from the fields section, expand out DimCustomer, drag over Country, expand out DimProduct, drag over ProductLine. Lastly, expand out DimSalesTerritory and drag over SalesTerritoryRegion. Uncheck “Add slicer to this page,” as we will add it in a moment to a new page.
This creates a new calculated set of fields in our Fields pane with the following DAX. We can change the name of any of the parameters for clarity here in the DAX. For example, we could edit ProductLine and SalesTerritoryRegion to be more user-friendly.
Dimension = {
(“Country”, NAMEOF(‘DimCustomer'[Country]), 0),
(“ProductLine”, NAMEOF(‘DimProduct'[ProductLine]), 1),
(“SalesTerritoryRegion”, NAMEOF(‘DimSalesTerritory'[SalesTerritoryRegion]), 2)
}
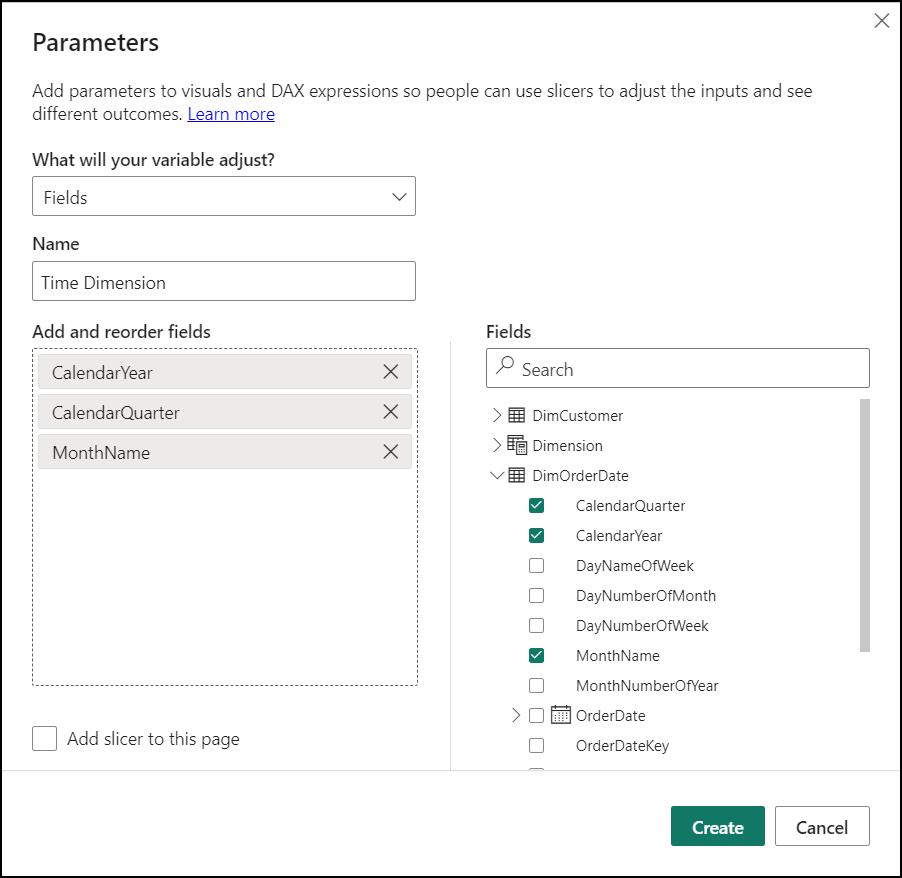
Next, we will repeat these steps to create a parameter called “Time Dimension” using DimOrderDate and bringing over CalendarYear, CalendarQuarter and MonthName.
Build a report with dynamic slicers using field parameters
Now that we have our parameters, we can build our report.
Add a new blank page if needed. On that page add a clustered column visualization. Resize it, leaving some room for the slicers.
From the Fields pane, drag Dimension ➔ Dimension to the X-axis dropzone, FactInternetSales ➔ SalesAmount to the Y-axis and Time Dimension ➔ Time Dimension to the Legend. Next add two slicers, adding Dimension and Time Dimension to each one.
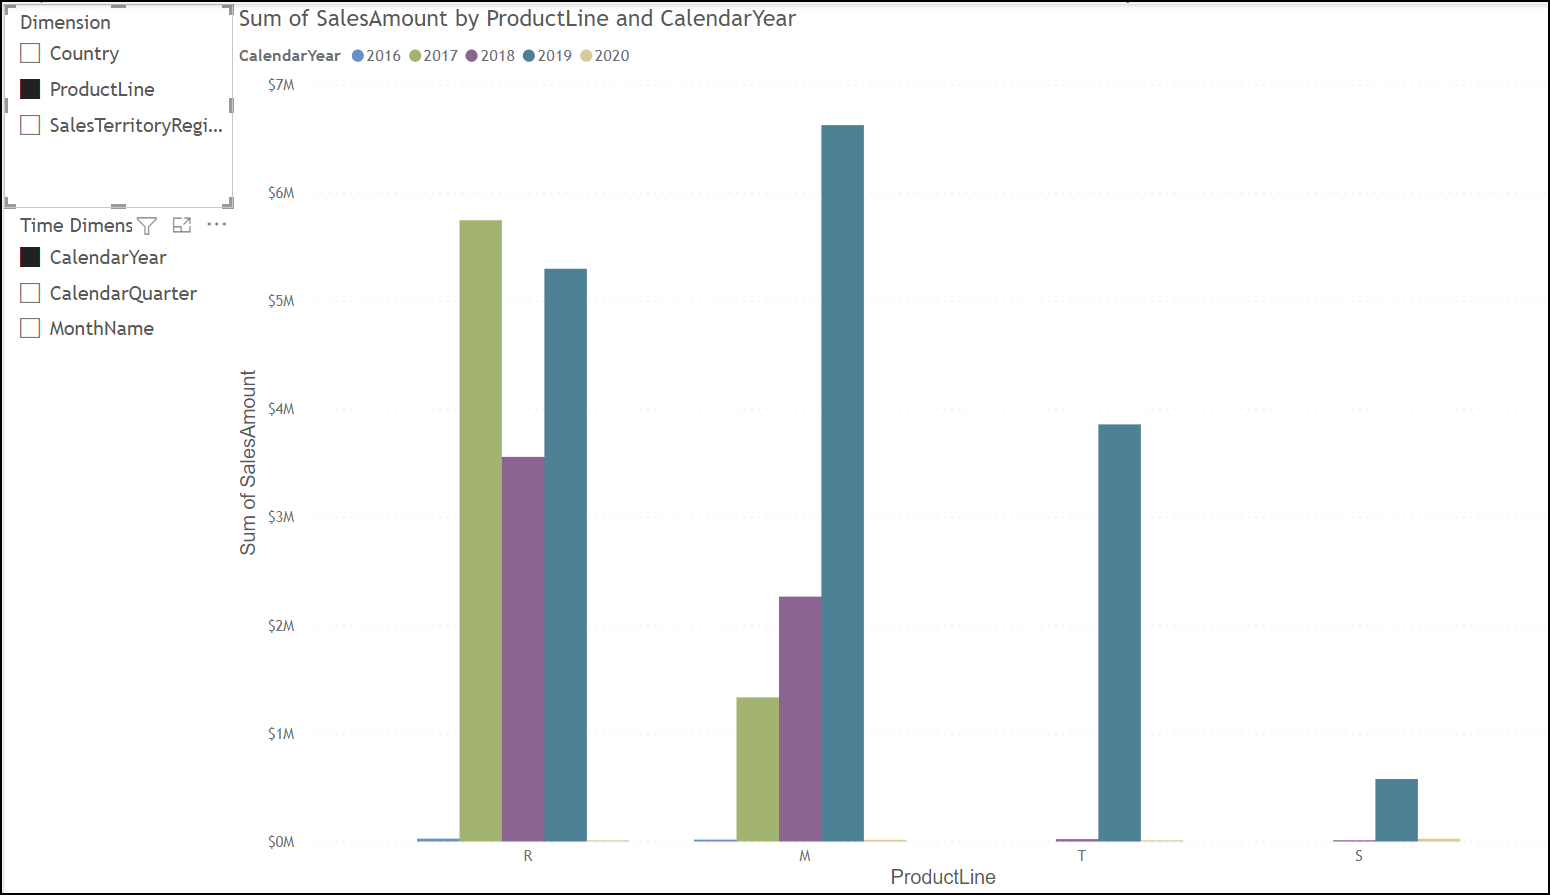
Our report now lets us change between the dimension and time period as desired. Before we finish, we will clean up the names in the slicers.
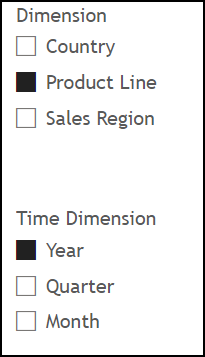
Under the Fields pane, click on Dimension. The DAX is shown above the report. Edit the names to be more user-friendly. Do the same with the Time Dimension. That looks better!
Limitations for dynamic slicers using field parameters
A few closing notes on this topic. There are some limitations to this functionality.
- Not all visualization types support this feature.
- There isn’t a “none” option for your slicer; however, not selecting any fields in the slicer does the same thing.
- Parameters cannot be created from live connections without a local model. However, if you use DirectQuery with datasets and Analysis Services, you can add a local model for parameters. To do this with measures, you need explicit DAX measures.
- Lastly, parameters can’t be used for linked fields in drill through or for tooltips.
If you liked learning about field parameters, you may enjoy our on-demand webinar Cool Power BI Functionality You May Not Know About. We share some of our favorite Power BI features that may have slipped under your radar:
Whether you’re using a fully Microsoft-based stack or a combination of multiple vendors, Senturus can help you fully leverage your Power BI environment. Learn about our Microsoft & Power BI consulting services.