In 2019, Tableau released over 200 new features. Significant enhancements were made in the areas of data security, data management, data presentation and ease of use. Amidst this sea of new features, there are a few standouts you don’t want to miss out on.
Below are my top 10 favorite features that came out for Tableau sServer and Tableau Desktop in 2019 and a list of some cool stuff in store for Tableau 2020.
Best 10 features to appear in Tableau 2019
- Tableau Server – Ask Data. With this feature, Tableau supports querying of data using natural language to ask questions. With ASK data, visualizations are built without the clicking and dragging normally required. For more details about Ask Data, see our blog.
- Tableau Server – Tableau Data Catalog. This feature is part of the Data Management add-on for Tableau Server (additional licensing cost required). With it, you can trace lineage and dependencies down to the field level to see the impact of a potential change. For more details about Tableau Catalog, see our on-demand webinar.
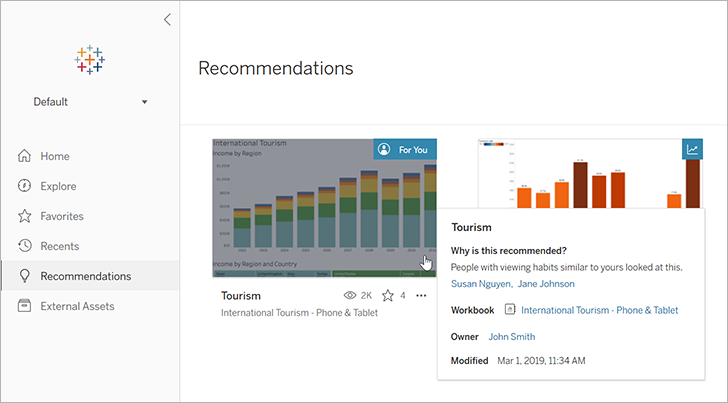
- Tableau Server – view recommendations. Tableau Server uses machine learning algorithms to help determine what views you might find best suited to display your data. It suggests views based on the data you’re pulling and data used by others with similar preferences.* See below:

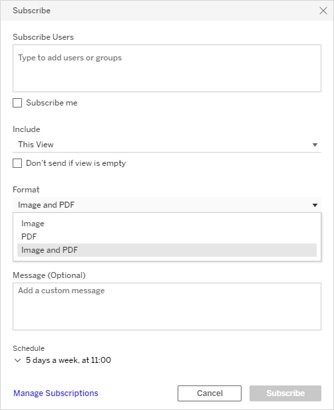
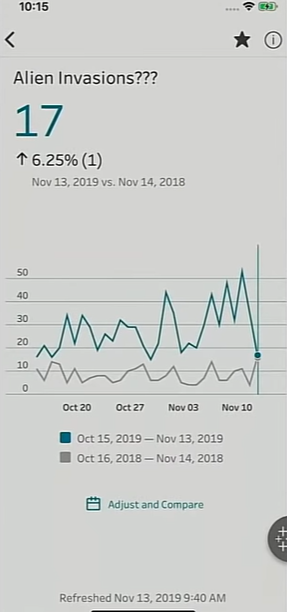
- Tableau Server – PDF via subscription. Tableau subscriptions are great for disseminating Tableau content on a regular basis. In Tableau 2019.3 subscriptions were enhanced and include support for PDF snapshots. This feature is useful for report bursting. See below:

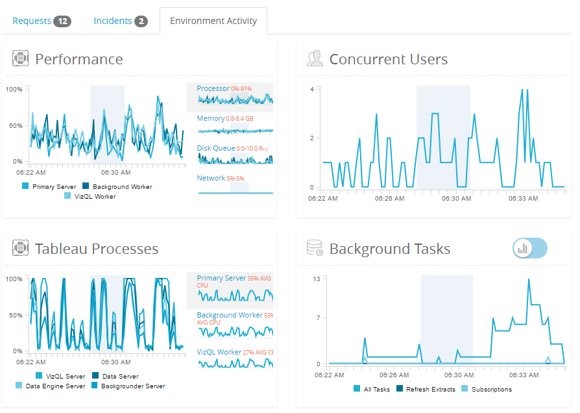
Get more details about Tableau PDF attachment subscriptions from our recorded webinar. - Tableau Server – resource monitoring. This tool provides a comprehensive look at the health of Tableau Server so you can identify what is causing slow load times, extract failures, etc. See below:

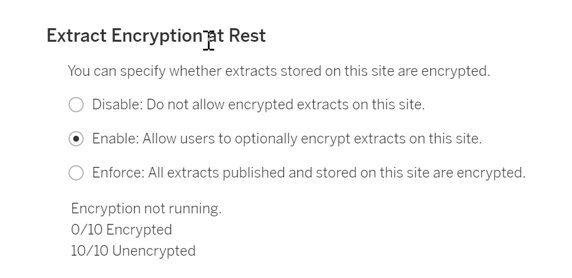
Get more details about Tableau Server resource monitoring from our on-demand webinar. - Tableau Server – encryption for extracts. Tableau’s new Encryption At Rest feature encrypts Tableau extracts on Tableau Server*. Tableau extracts are persistent data files (stored on disk) and may contain sensitive data. Previously, there was no way to encrypt this data, which created the potential for a security breach. See below:

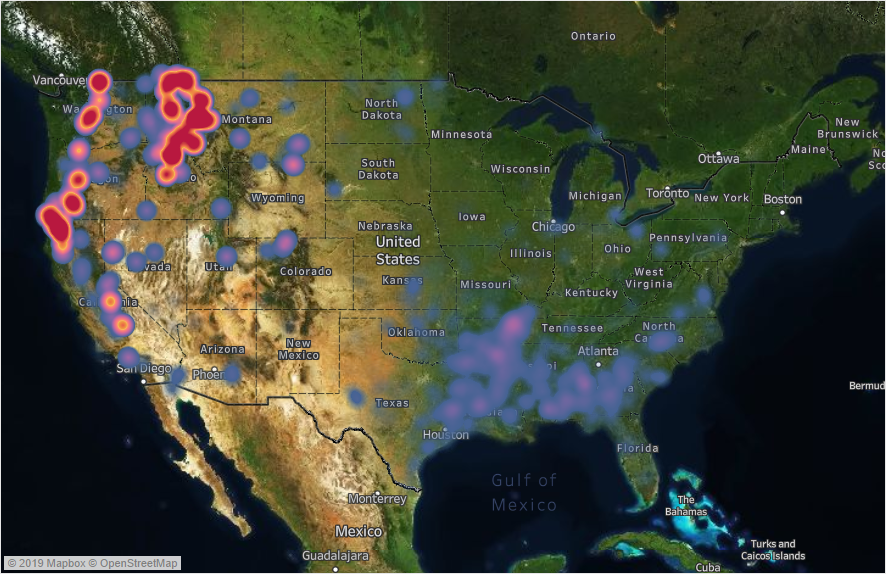
*For details about Tableau server 2019 new features see our on-demand webinar on Tableau 2019.3. - Tableau Desktop – mapping enhancements. In 2019, Tableau introduced vector maps* and began using Mapbox as its map provider. These enhancements provided better clarity of maps when zooming and allowed for the display of satellite images and density/heatmaps.

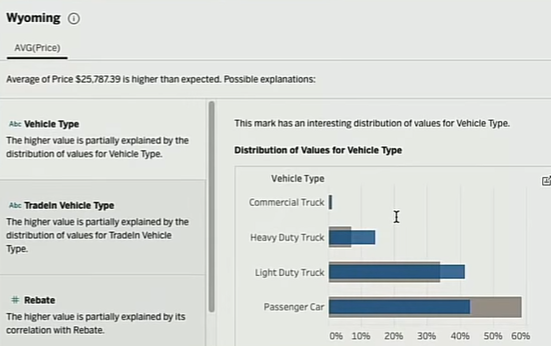
*Mapping came a long way in Tableau 2019. For more details, see our on-demand webinar about mapping in Tableau. - Tableau Desktop – Explain Data. This is a great new feature! It lets you go beyond what happened to why it happened. When viewing data elements or “marks,” clicking on the lightbulb icon launches Explain Data, which offers further insights into what is behind that mark. Explain Data can also build visualizations to show outliers and data anomalies and how they affect your data landscape.The below example shows the average price of cars. The state of Wyoming was higher than normal. By clicking on the state in the map and the lightbulb icon to launch Explain Data, we are given multiple explanations as to why this is the case. Explain Data automatically built the sets and visualizations to help determine the root cause of this data anomaly. You can use the go to sheet button to further explore the data behind the anomaly.

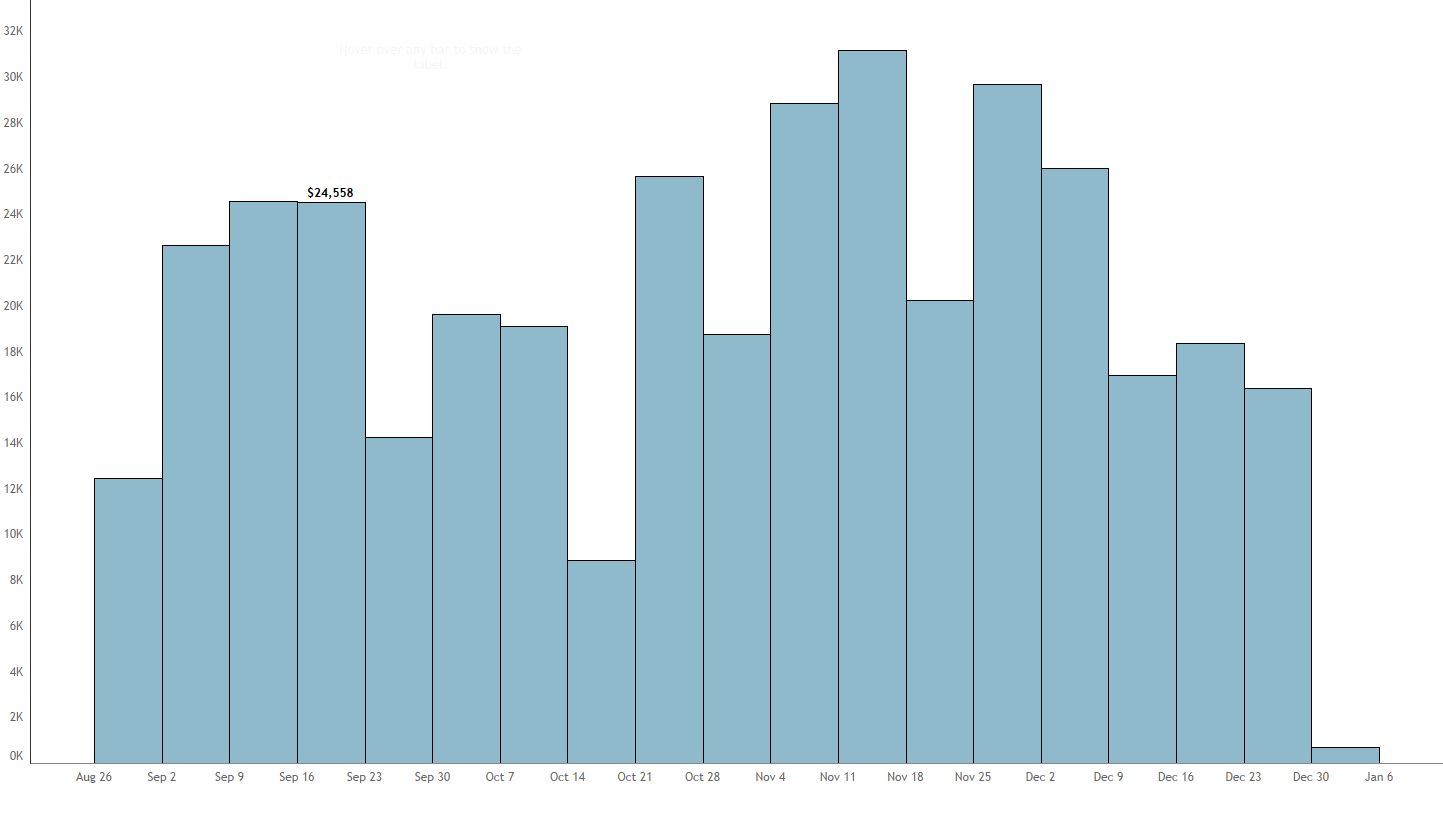
Get more details about Explain Data in our on-demand webinar. - Tableau Desktop – parameter actions. Instead of selecting items from a list of values in a parameter or highlighter, you can trigger actions by interacting with the viz itself. Use cases for this feature include changing labels, shapes and colors dynamically by hovering.See below. The label only shows up when hovering on a bar:

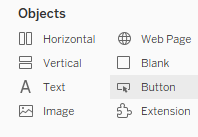
- Tableau Desktop – show/hide buttons. Buttons are a new type of dashboard object that are useful for displaying instructions or warnings before someone opens a worksheet (i.e., “Warning! This dashboard is under construction.”). These buttons can also be used for sheet swapping and as a mechanism to show/hide filters behind one icon. Buttons can be an image or text. See below:

Yep, 2019 was definitely great year for Tableau. Tremendous strides were made in Tableau Desktop that open up the possibilities for better, more flexible and more compelling visualizations. In addition, there were a lot of features added in the areas of Tableau Server management and security that truly bring Tableau to the next level.

What’s in store for Tableau in 2020
So, what goodies does Tableau have in store for 2020? At the Tableau Conference we were given some ideas on what is coming down the road. Below are my best-of picks for new features projected for release by Tableau this year.
Disclaimer: Dates and details of these features are subject to change as these are still in development.
-
- Tableau Desktop – data modeling. Tableau refers to this feature as “The Noodle” and it’s getting closer to production. This feature is a big one… so noteworthy, it deserves its own blog! In the past it could be difficult to join tables. Not only did you need to know a lot of about the join types needed, the data needed to be at the same granularity. Often complex LOD calcs were required to just give you the “right” numbers. This was because Tableau would always join all tables prior to putting them into the viz. As a result, you’d end up with a wide datafile with lots of repeated information. Tableau’s new data modeling features eliminate much of that pain and provides a few benefits:
- You can keep tables separate until you are ready to create the viz. Which often means no repeats and no over inflated values. This should eliminate the level of detail calcs often used as a workaround for these problems.
- You can build multi-fact data models. Using the new Noodle feature you can build relationships as an alternative to joins. This function is super useful when joining two fact tables. In the past, data often exploded when doing these types of operations. Now with relationships, each table stays independent and remains its original size.
- You get a number of records for each table. These will give you accurate counts that are often useful when building visualizations.
- It speeds up the extract creation process, which can be a bottleneck for many customers.
These data modeling capabilities are expected to come out in the latter half of 2020. There was a great session on describing these new features given at the TC19. Watch this session in its entirety.
- Viz animations – Tableau Desktop, Tableau Server, Tableau Mobile and Tableau Public. This really cool feature was demo’ed at TC19. Animation brings your visualizations to life! Changes when filtering can now happen dynamically, instead of the before-and-after static image we have today. This feature is expected to be in 2020.1. Check out the pre-release website for a live example.
- Metrics (KPIs) Tableau Server, Online and mobile. This feature is a big deal! It has always been difficult to build KPI dashboards in Tableau. Just performing a year-over-year comparison of metrics like profit ratio required multiple steps and lots of calculations and custom formatting. To learn how to do a big numbers KPI dashboard in Tableau now, read our step-by-step tutorial. With the upcoming Tableau Metrics feature, it should be simple to build KPIs with year-over-year comparisons. While the new capability was demo’ed during the Keynote at TC19, no release date or timeframe was given. See the below image of a Metric shown on Tableau Mobile:

- Tableau Desktop – dynamic parameters. In prior releases, parameters were fixed. If the data changed, you would have to republish the workbooks to get current data. In Tableau 2020.1, Tableau will automatically update the parameter’s list of values and a workbook is opened. This is one of the most requested features of all time!
- Tableau Prep Builder – lots of enhancements.
- Write to database. Output database table. Previously, Tableau Prep would only output a Tableau data file (extract) or a CSV file. If you wanted to do some data cleansing and write your new data to a database table you had to use other ETL tools.
- Web interface. Previously, Tableau Prep was client-based software. Soon, there will be a web-based tool option as well.
- Rank. In one step, you can add a Rank (built-in calculated field) as a new column.
- Reusable steps. For use in Tableau Prep and Prep Conductor, this feature provides the ability to reuse steps in other flows.
- Incremental refresh. Run Tableau Prep flow only for new data.
- LOD support in 2020.1. Create level of detail calculations in Tableau Prep.
- Tableau Public – web authoring. Previously, Tableau Public was only client-based software you had to download.
- Tableau Server & Tableau Desktop – login-based license management. Managing Tableau Desktop and Tableau Prep license keys have always been a bit of a pain. As it exists currently, you must distribute license keys to all Desktop and Prep users. Expected to be in production in Tableau release 2020.1, this feature moves the management of license keys to Tableau Server or Tableau Online and should simplify this process. Here is a screenshot from the pre-release:

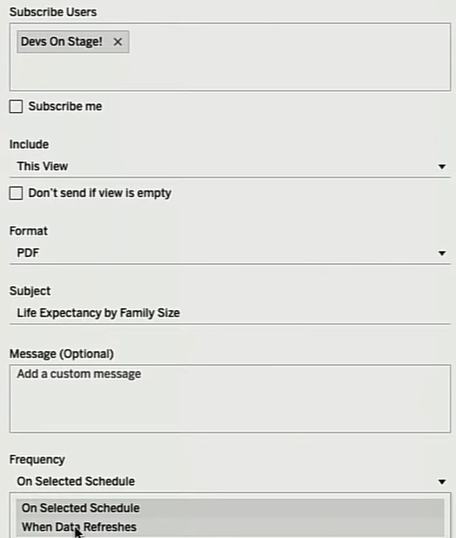
- Tableau Server – subscription after data refresh.

- Tableau Desktop – data modeling. Tableau refers to this feature as “The Noodle” and it’s getting closer to production. This feature is a big one… so noteworthy, it deserves its own blog! In the past it could be difficult to join tables. Not only did you need to know a lot of about the join types needed, the data needed to be at the same granularity. Often complex LOD calcs were required to just give you the “right” numbers. This was because Tableau would always join all tables prior to putting them into the viz. As a result, you’d end up with a wide datafile with lots of repeated information. Tableau’s new data modeling features eliminate much of that pain and provides a few benefits:
Out with the old year in with the new
Looking at the top features lists, it’s clear that Tableau added a ton of value to the product last year and they are continuing the trend into 2020. While this blog picked my favorite features, there are many more. With all of these enhancements to Tableau Desktop, Tableau Prep and Tableau Server, Tableau is truly morphing from more of an end user reporting tool to an enterprise quality tool in the areas of data management, data analysis and data presentation.
I can’t wait to see what 2021 will bring!
This blog was submitted by our own Monica Van Loon. A frequent contributor to our blog, Monica is Tableau certified and teaches many of our Tableau workshops.