Many people consider Tableau to be THE premier tool for visual analytics. But Power BI is giving Tableau a run for the money. Look at Gartner’s 2020 Magic Quadrant for Analytics and Business Intelligence Tools and you’ll see Tableau and Power BI solidly in the leader category. (Read our Gartner 2020 recap.)
With two great tools vying for attention, it can be tough landing on the best choice for your next project. Read on to learn the five areas where we feel Tableau outshines Power BI. If your evaluation criteria are focused on these areas – or one of these is on your list of must-haves, Tableau may be the best tool for you.
If you want a more broad comparison of the two tools, review 50 Features & Functions Comparison: Power BI, Tableau and Cognos. We provide an unbiased comparison of 50 features and functions in easy-to-interpret visuals.
The big five
Tableau and Power BI continue to develop new capabilities and enrich their respective offerings. Today’s deficiencies could be addressed in an upcoming release. Following are the five areas where we feel Tableau outshines Power BI…for now.
-
- Web authoring
- Dashboard creation
- Ease of use
- Scripting languages
- Vendor independence
Web authoring
Tableau’s browser-based development environment is more fully featured than Power BI’s.
Tableau offers a client-based tool (Tableau Desktop) and browser-based report authoring in Tableau Server. Over the last few years Tableau has really ramped up its web authoring environment. In fact, just about everything you can do in Tableau Desktop can now be done in the browser.
Power BI offers a client-based tool (Power BI Desktop) and Power BI service. But browser-based report development in Power BI service is limited. For example, you cannot create new measures and calculated fields on the web service. Nor can you change the data model. Given Microsoft’s vast development resources these limitations may get addressed, but for now Tableau outshines Power BI in browser-based development environment.
Dashboard creation
Tableau offers lots of options for fine-tuning at the dashboard level; the same is not true in Power BI service.
In Tableau, dashboard creation is done either in Tableau Desktop or Tableau Server. Tableau provides a great host of dashboard objects to choose from. For example, you’ll find layout containers and dashboard actions, buttons, and multiple device layouts (including layouts for mobile devices, as shown in this example).
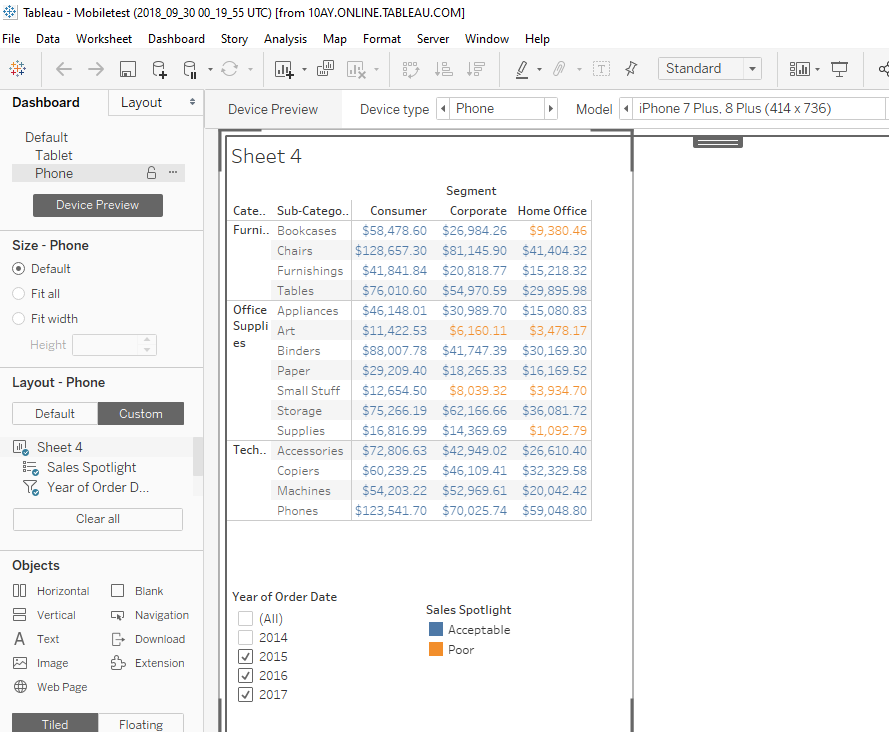
In Power BI, a dashboard can only be created at the Power BI service level. Reports can be added to dashboards as tiles. While Power BI offers some of the same functionality as in Tableau, it does not have as many options for fine-tuning at the dashboard level .
Ease of useTableau Desktop was first released in 2003. Over the last 18+ years Tableau has fined tuned the user interface. It’s super intuitive and does a lot of the work for you. Tableau is easier for non-technical users than Power BI. Take the Show Me function for example. Say you bring in dates, city, state and zip/postal code. Tableau will usually assign each of the items the correct data type. The Show Me feature presents options for graphically representing that data. Only the visualization types appropriate for those data types will be highlighted. This makes it easy to try out multiple ways of graphically representing data with a single click. |
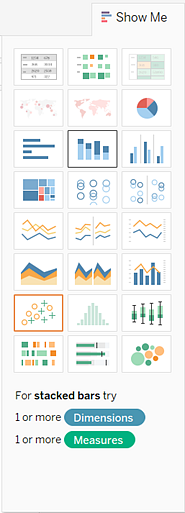 |
Scripting languages
In Tableau, you use SQL to model complex data models. In Power BI you use the M language, a functional language that isn’t as intuitive or widely used.
When creating calculated fields, Tableau provides a set of built-in functions and a calculation editor with examples of how to use each function.
Power BI uses DAX to create calculated fields. DAX is similar to Excel scripting and has similar functionality to what’s offered in Tableau. DAX is a bit more complex and can be difficult to learn for novices.

Vendor independence and server support
Tableau is vendor independent when it comes to the front-end development tool, server platform and back-end data source support. It is no surprise Power BI works best within the Microsoft stack. If your developers prefer using a Mac or your server administrators prefer an on-prem Unix server, Tableau outshines PBI in this area.
Examples of vendor independence in Tableau
- Mac support. Some BI developers prefer to work on a Mac, and you can do so in Tableau Desktop. On the other hand, Power BI Desktop is a Windows-only application and will not run on a Mac. NOTE: There are workarounds to this in Power BI.
- Server support. It is often necessary to have multiple servers to support an enterprise-wide analytics solution. If you prefer on-prem servers for your company’s back-end, that option is not available for Power BI. Microsoft offers a lightweight Report Server option but it doesn’t have the same capabilities as Microsoft’s (cloud-based) Power BI service. If on-prem servers are a requirement, then Tableau is the better choice as it fully supports both Windows and Linux on-prem servers.
- Data source support. Both Power BI and Tableau support many data sources. While Tableau has had the longer list of data sources it supports, Microsoft is catching up fast! But even if Tableau and PBI end up running neck and neck here, it is important to look at how well a particular data source is supported.Take Salesforce data support for example. Power BI does support Salesforce as a data source, but Tableau offers more Salesforce specific features (no surprise here as Tableau was recently acquired by Salesforce). Tableau also offers Dashboard Starters for Salesforce and other data sources such as LinkedIn Sales Navigator, Marketo, Oracle Eloquoa, ServiceNow and Snowflake.
Here’s an example of just one of Tableau’s Salesforce Dashboard Starters.
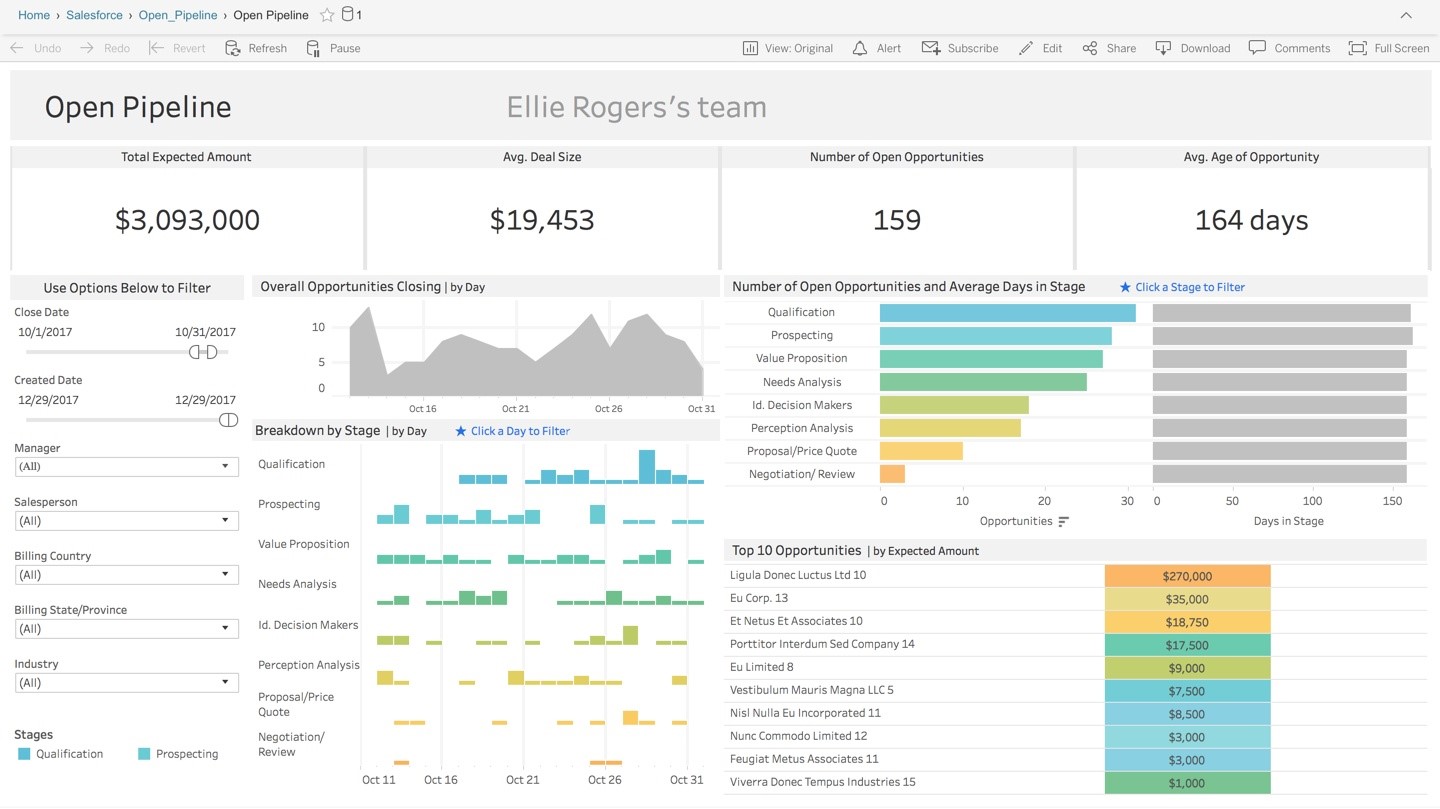
Tableau vs. Power BI: a difficult choice
Tableau and Power BI are both excellent tools with wide market adoption. Both are backed by solid companies (Salesforce and Microsoft).
For many projects either would suffice but there are functional areas where one outshines the other. Tableau’s UI and features make it very easy to learn, especially for novice users. Power BI is deep in functionality, but seems to be geared towards a technical user (think developer). Tableau also shines in the areas of on-prem server support and browser-based report development. If these areas are on your “must-have” list, then Tableau may be the best choice for you.
Hopefully, this blog helped you get clarity. If you want the mirror perspective, read our blog where we list and discuss areas where Power BI outshines Tableau.
If you need more help deciding which analytics tool best suits your requirements, contact us. At Senturus, we are fluent in Power BI and Tableau (and Cognos too). We provide consulting, training, staffing and mentoring in all three platforms.
We know how each tool performs in different environments and are deeply familiar with the requirements, benefits and trade-offs of each. We are happy to help you weigh the pros and cons of each as they relate to your business so you can be confident you are investing in the right tool for the job.
This blog was submitted by our own Monica Van Loon. A frequent contributor to our blog, Monica is Tableau certified and teaches many of our Tableau workshops.