When companies are looking at business intelligence/analytics tools, Tableau and Power BI are usually in the running. Gartner’s Magic Quadrant for BI Tools and Analytics ranks both platforms solidly in the leader category.
Both Power BI and Tableau are relatively even. For most applications, you cannot go wrong with either. Both check most of the boxes on the evaluation checklists. Both meet the majority of requirements. So how do you determine which one is the right tool for the job?
The answer is, it depends on your requirements. Even though the two platforms offer many of the same capabilities, Power BI has a leg up over Tableau in five areas. If these five rank high on your list of requirements, this information can help guide you to the correct choice for your company.
5 areas Power BI outshines Tableau
-
- Transformations
- Cost
- Openness and familiarity
- Centralized functionality
- Built-in standard visualizations

Transformations
Transforming data into a user friendly and usable format can be complicated. Visualization tools that perform data transformations well really stand out from the pack. Power BI is one of those tools. It provides more options for data transformations than Tableau. As such, Power BI is closer to being an Extract, Transform and Load (ETL) tool than Tableau.
For ETL/transformations, Tableau offers Tableau Prep Builder for building transformation “flows” (a series of steps to be applied to data) and Tableau Prep Conductor for scheduling flows. While these products have seen dramatic advancements since their initial release, both are still fairly limited as ETL/data transformation tools.
Below are a few features for transforming data in Power BI that set it apart: it would be great if data was formatted perfectly for analytics from the start. But this is usually not the case. Most of the time, the bulk of the work required to set up analytics (like 90%) is getting data into the right format.
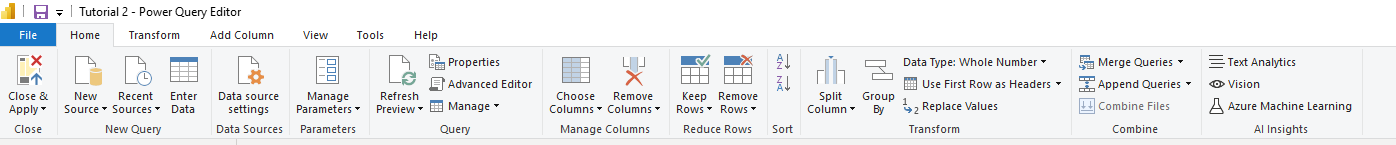
- One button transformation option – Power BI Desktop makes it super easy to do transformation without coding. It offers a one button transform option for many common tasks such as removing rows or columns, splitting columns, replacing values and grouping. The image below shows a few of the one button transform options available in Power BI Desktop.
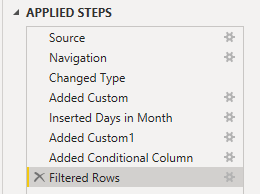
- View results of each transform step – Power BI lets you easily review all your transformation steps and preview what the data looks like after each step. This feature is great for debugging multi-step transformations. Simply click on the step and the results will be shown in a data preview pane.
- Dialog box/templates – When creating custom columns using IF THEN ELSE logic, Power BI provides a dialog box/template that makes it easy to build custom columns without suffering syntax errors.
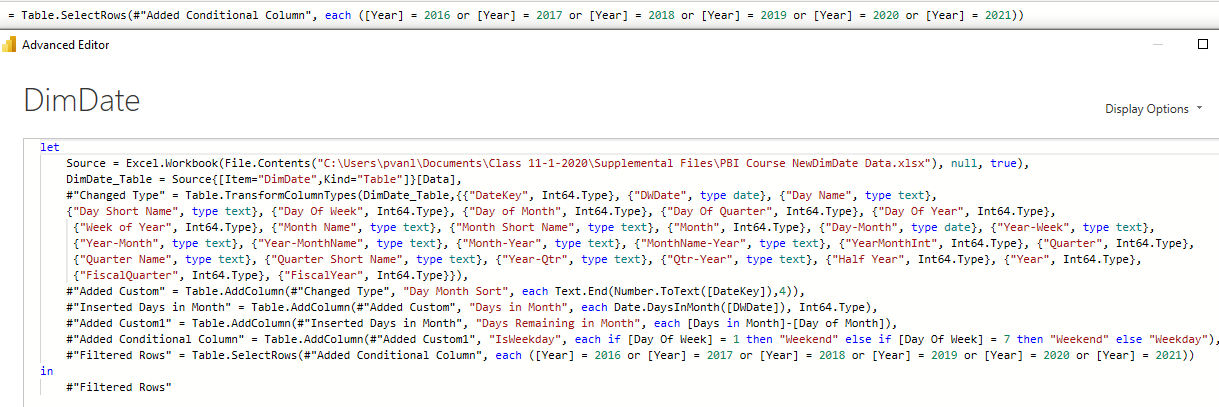
- Advanced Editor feature – The Advanced Editor in Power BI Desktop lets you view—and then easily add to or modify—the underlying M code used to perform transformations. Below is an example of the Power Query code used to build a custom column called “Is Weekday.” It shows the resulting M code displayed in the Advanced Editor.
- Undo transformation steps – You can quickly delete transformation steps by clicking on the “X“ (shown below). You can undo your steps all the way back, if needed.

Cost
You can’t beat the price – Power BI Desktop is FREE!
If you need to publish, you will need a Power BI Pro license, which is $10 a seat. More advanced publishing and sharing will require Power BI Premium, which is licensed at $4995 monthly per dedicated cloud resource. See Microsoft’s notes on pricing or our blog for details on Power BI licensing.
Licensing options for Tableau include Tableau Creator, Tableau Explorer and Tableau Viewer. For development you will probably need a Tableau Creator license, which is pricey at $70 per month per user. Tableau Creator is the only license that comes with Tableau Desktop and Tableau Prep.
While not exactly an apples to apples comparison between Tableau and Power BI, for development most users will find Power BI less expensive than Tableau. Read our blog for more details on licensing with Tableau.
Openness and familiarity
The Microsoft family of apps, including Office 365, Azure, Sharepoint, Excel, Power Pivot, Analysis Services and now Power BI are all very popular. Many share a similar look and feel. For analysts who traditionally spend a lot of time in Excel, this UI familiarity is a welcome benefit and tends to make the learning curve for Power BI less steep than it is for Tableau.
In addition, Microsoft Excel, Power Pivot and Analysis Services all use DAX (Data Analysis Expressions) to build their formulas and expressions. DAX has a comprehensive library of built-in functions and is especially good at building period-over-period comparisons (i.e. YOY, MOM), a task that can be difficult in Tableau.
Finally, Power BI’s adherence to industry standards makes it more open than Tableau. For example, while Tableau extracts can’t be used outside of Tableau, Power BI datasets support XMLA, allowing datasets built in Power BI to be used in other tools including Tableau.
Centralized functionality
With Power BI, functionality is pretty much centralized. You use Power BI Desktop for data transformation, data modeling, report development and natural language queries. Tableau, on the other hand, requires separate tools to perform many of these functions.
Below are some examples of functions that are separated out in Tableau
- Transformations and ETL – Only basic transformations (i.e. change data types) can be done in Tableau Desktop. More complex transformations require Tableau Prep, a separate tool that is only available for those with the Creator Tableau license. Tableau Prep generates a file that is then fed into Tableau Desktop or Tableau server.
- KPIs/ Metrics – Tableau recently released Metrics for building key performance indicators (KPIs). It’s a welcome and exciting new feature, but it is not available in Tableau Desktop. Metrics must be built in Tableau server. Read our blog Lessons and Limitations of Tableau Metrics. In contract, Power BI’s KPI feature, albeit not a perfect implementation, is provided as a Power BI “standard” visualization.
- Natural Language Query – Tableau’s support for Natural Language Query is called Ask Data. (Read our blog for a primer on Tableau’s Ask Data.) This helpful feature lets you ask questions of your data in everyday language, such as “who is my top customer this year?” The downside of Ask Data is that it’s a separate tool. Equally helpful but easy to access, Power BI’s version of Ask Data, called Q&A, is integrated into Power BI Desktop.
Built-in standard visualizations

Power BI includes a variety of visualizations that are easy to build and come standard with Power BI Desktop. These include: Waterfall, Funnel, Gauge Chart, Ribbon, Decomposition Tree and KPI.
These visualizations do not come standard in Tableau. Most can be built in Tableau – but doing so is time-consuming.
Power BI and Tableau: two great analytics tools
Both Tableau and Power BI are great tools. When you ask around, you’ll find fans on each side and it’s hard to make a decision. As you’ve read, Power BI has a lot to offer especially when it comes to transforming data, ease of use, openness and cost. If these items top your evaluation criteria, you may want to consider Power BI over Tableau.
At Senturus, we are fluent in Power BI and Tableau (and Cognos too). We provide consulting, training, staffing and mentoring in all three platforms. We have firsthand experience in both Power BI and Tableau and know how each tool performs in different environments. Being deeply familiar with the requirements, benefits and trade-offs of each, we are completely tool agnostic.
If you need more help deciding which analytics tool best suits your requirements, contact us. We are happy to help you weigh the pros and cons of each as they relate to your business so you can be confident you are investing in the right tool for the job.
This blog was submitted by our own Monica Van Loon. A frequent contributor to our blog, Monica is Tableau certified and teaches many of our Tableau workshops.