Tableau is truly an amazing analytics tool. You can build beautiful, impactful, insightful dashboards – sometimes in mere minutes. And things typically go smoothly when it’s used at the departmental/desktop level.
So why then, when Tableau is rolled out to the enterprise, are people experiencing all manner of complications and difficulties?
|
|
|
|
|
|
|
|

If only…insights from the Tableau trenches
As the old adage goes “hindsight is often 20/20.” Many of the problems we encounter when clients contact us could easily have been avoided if only they had known a few simple things.
Here’s our list of the 10 most valuable insights gleaned from our experience in the Tableau trenches. Insights that can help you avoid the costly and time-consuming problems.
- Tableau can’t do everything. Play to Tableau’s strengths and offload other tasks. Use Tableau at what it’s good at: being interactive, exploratory and visual. Don’t use it to build spreadsheets, extract data or build “pixel-perfect” financial reports.
- Don’t replicate what you already have. Don’t use Tableau to just duplicate a complicated text-based report you have in Excel or another reporting tool. Look at your current reports and consider
- How can they be improved?
- What follow-up questions do users have that can’t be answered with the current reports?
- How could you allow people to answer their own questions?
- Leverage your current BI stack & data warehouse. Companies have a lot of time, money and thought invested in their BI and data warehouse environments. These environments contain crucial business and security rules, vetted data, calculated fields and user-friendly column names. Don’t circumvent all this work by dumping data into Excel, transforming it manually and then using that for your data source in Tableau. Instead, leverage that validated, clean descriptive source data your company already has in place. If you already have a robust meta data layer built in Cognos, you can connect to Power BI and Tableau using the Senturus Analytics Connector.
- Analysts need training to become Tableau authors. Business analysts aren’t typically designers or data modelers. These roles require a different mix of skill sets.
 Building an effective visualization is about good visual design and storytelling. Analysts often need support to expand their visualization skills and can greatly benefit from training in visualization best practices. You can also get guidance from recognized authors such as Edward Tufte and Stephen Few, both of whom have published great books on visualizations, and from our on-demand webinars Information Dashboard Science and Design and 10 Best Practices for Tableau Dashboard Design. There is also inspiration online, join the Tableau Public Community, and check out the Gallery to see the Art of the Possible.
 - Less is more. Don’t try to cram too many worksheets on one dashboard. Visual overload only confuses your audience and they won’t be able to pick out what is truly important. Simplify, simplify, simplify. Less colors, graphs and charts are better than too many.

Information and visual overload: one dashboard, way too much info - Focus on maintainability. Think long-range even when you are building a “quick dashboard.” Consider what may affect the maintainability of your dashboard in the future and plan ahead. Try to avoid using new workbook and data source for each and every request. Instead, develop one dashboard that serves multiple audiences. When creating your dashboards and workbooks consider the following
- Complexity
- Security and access control
- Sheer quantity of data sources, workbooks
- Different versions over time
- Personnel changes
- Lack of standard approaches
- Lots of replicated one-offs versus well-thought out models
- Duplicated data modeling in every workbook
- Data preparation is critical. Nobody’s data is as perfect as the Tableau Superstore sample dataset. At Senturus, we are huge advocates of the premise that you should always “use the right tool for the job.” Do the data prep in an ETL (Extraction Transformation and Load) tool designed for this work. You can do a lot with custom calculations, filtering and custom SQL in Tableau but the question is…should you? Do the complicated calculations in the backend database whenever possible. Database servers are good at this type of work, and they normally reside on a server that has much more capacity than a desktop.
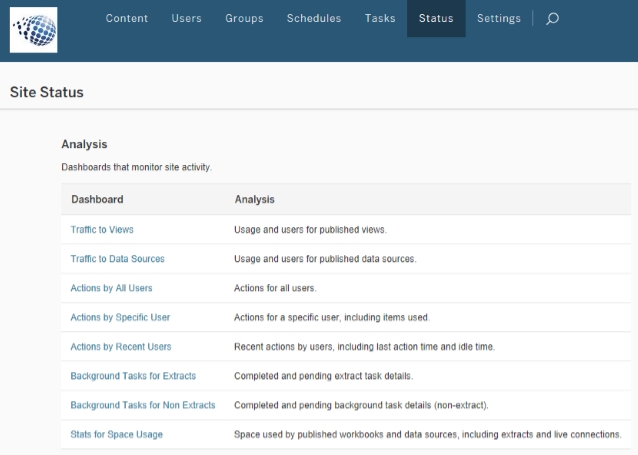
- Keep Tableau Server from becoming a dumping ground. When you’re doing an enterprise roll out of Tableau, it’s definitely a good time to deploy Tableau Server. With it, you can define projects with security, automate extracts, set-up subscriptions and centralize your data. However, as time goes on, Tableau Server often becomes a dumping ground full of stale duplicated data, unused workbooks and content that is no longer relevant. To prevent this, use Tableau Server’s built-in “Site Status” to monitor your Server and determine what to keep and what to put in a “to be discontinued” area. After six months to a year, delete what is unused. This practice will keep your Tableau Server environment organized and make it easier for users to browse.

Tableau Server site status - Having a “Single Source of the Truth” still matters. Beware of working off multiple versions of data. When everyone has their own copy of data and their own calculations to transform and supplement, they turn up at meetings and their numbers don’t match up. This isn’t good! Following these simple practices can save you headache down the road
- Designate a data steward to act as the gate keeper
- Implement a data promotion strategy
- Make sure only vetted data sources get to the production environment
- Publish one Tableau data source with the enhanced fields, parameters and hierarchies
- Consider centralizing core dimensions, hierarchies, metrics, datasets
- Remember, a data warehouse or data repository still has significant value
- Shared environments will affect user experience. Separate the sandbox from the board room. Have a development environment and a production environment with a promotion or vetting procedure in place to move between the two. Make sure your Tableau content is regularly patrolled and monitored to ensure it is still relevant (see Tips 8 and 9).
 Building an effective visualization is about good visual design and storytelling. Analysts often need support to expand their visualization skills and can greatly benefit from
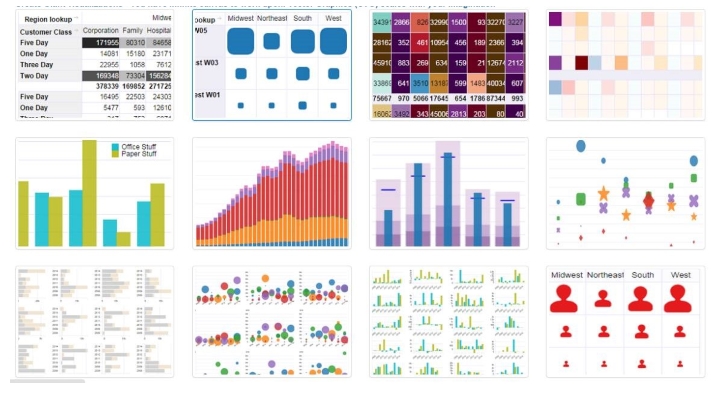
Learn Tableau. Expert instructors. Advanced topics.
Ready, set…roll out!
Being forewarned is forearmed. We have helped many clients address the avoidable growing pains associated with a Tableau roll out. Using these pointers, their pain can be your gain.
We hope these tips and insights will help you migrate from a Desktop Tableau environment to an enterprise Tableau environment painlessly and effortlessly.
If you liked this blog, you may also be interested in these Tableau on-demand webinars:
Tableau Dashboard Design Best Practices
Senturus Analytics Connector: Connecting Cognos data to Tableau and Power BI