- Webinar
Creating a Power BI Report Your Boss Can Navigate
How to design a user-friendly nav experience.

How to design a user-friendly nav experience.

Most companies use more than one BI tool, we examine bimodal analytics so tools run optimally.

Agile, governed self-service BI with a focus on Cognos Analytics.

We took Ask Data for an extensive test drive and answer lots of questions.

How-to demo and discussion of pros, cons and considerations.

Get a better understanding of Power BI licensing.

How BI teams build great reports consistently.

Learn how to overcome printing report challenges with Power BI.

A simple exercise showing the types of Salesforce reporting you can do with Power BI.

Power BI resolves many of the pixel perfect, burstable and paginated report issues.

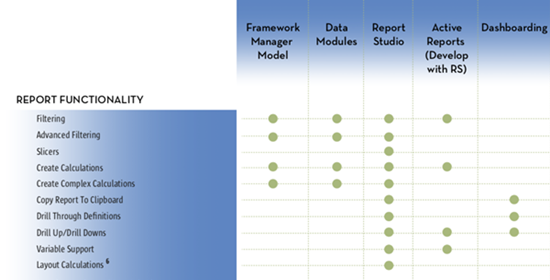
Visual reference guide of Cognos tools along with 60-plus capabilities.
Go from data dump to data discovery.

Step-by-step demo showing how to create a Tableau worksheet leveraging a group.

Learn how to swap out a reporting database for Tableau’s default extracts.

Options for performing complex aggregations in Tableau Desktop.