More and more companies are moving towards the adoption of a bimodal approach to analytics. It’s rare for us to find a client using just a single tool. Most use two or three.
This move towards adopting multiple tools bucks the long standing industry axiom that touted standardizing on a single tool. But with super-fast computing and big data, organizations have come to the realization no one tool or platform can meet all their BI needs.
Implementing a bimodal approach opens the door for richer and varied analysis. It also presents issues around security and performance because the tools don’t natively speak to each other and do not work off the same data source.
In this blog, we’ll take looks at the birth of bimodal, the pros and cons of this approach and how to cross the divide so that the tools run optimally and reduce overhead.

The birth of bimodal
The term “bimodal IT” was coined by Gartner back in 2014. Per Gartner, a bimodal approach supports two types of analytics:
Mode 1—predictable, improving and renovating in more well understood areas
Mode 2—exploratory, experimenting to solve new problems.
Specifically, Gartner surveyed clients asking the question “Does your organization explicitly have two parts in its IT organization or project portfolio – one more safe predictable and industrialized, the other more innovative, fast and/or collaborative—in other words, a bimodal approach to IT?”
Besides being a serious contender for longest run-on sentence in history, the question acknowledged a new and important business trend. This trend is particularly interesting given that the earlier industry mantra focused on standardizing around fewer technologies.
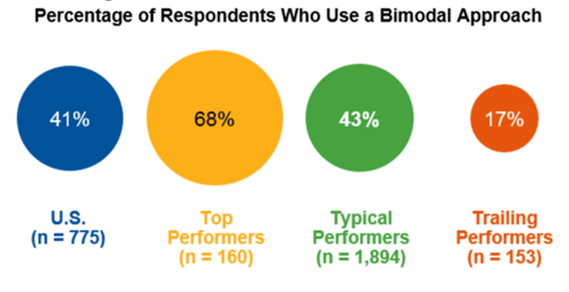
According to the 2017 CIO Agenda: A U.S. Perspective, 09 February 2017, what is notable about the bimodal trend is that the number of companies adopting this approach is growing and those adopting it successfully seem to perform better.
It’s well documented that companies that leverage analytics are more successful, overall. But the idea that supporting two distinct types of BI environments is better than one could rightly be viewed with some skepticism, if not considered outright blasphemy.
Gartner, however, sees the bimodal approach as necessary to drive “digital transformation.” Mode 1 is “optimized for predictable, well-understood areas” targeted for “renovating…into a state that is fit for a digital world.” Mode 2, on the other hand, is “exploratory, experimenting to solve new problems and optimized for areas of uncertainty. These initiatives often begin with a hypothesis that is tested and adopted during a process involving short iterations, potentially adopting a minimum viable product (MVP) approach.”
Gartner goes on to posit that both modes are “essential to create substantial value and drive significant organizational change, and neither is static. Marrying a more predictable evolution of products and technologies (Mode 1) with the new and innovative (Mode 2) is the essence of an enterprise bimodal capability.”
How a bimetal approach translates to business analytics
As we see it, you can loosely define Mode 1 tools as traditional or legacy BI, with its slower development cycles and highly curated models. This would include Cognos, Business Object, MicroStrategy, OBIEE types (although one can make the argument that these tools are fighting their way into the Mode 2 space). Mode 2 consists of new, agile, visual tools like Tableau, Power BI, Qlik, Spotfire, SiSense, etc.
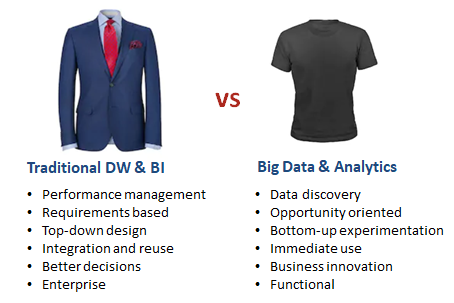
Gartner categorizes the two styles of use cases as “Suits” and “T-Shirts” and makes this comparison between the two:
Mode 1 and 2 tools: pros and cons
Mode 1 tools: The push for standardization on a single solution—Gartner’s Mode 1—arose from the desire to drive costs out of the organization. Having one BI solution has many benefits in terms of managing only one “stack.” In other words, that’s everything from hardware to software, model development, report creation, administration, training, upgrades, performance tuning and optimization and lifecycle (Dev, QA, UAT, etc. environments).
Having a “single version of the truth” was also touted as a big benefit of the Mode 1 approach. It means organizations could be relatively confident that their decisions being made were based off a somewhat consistent set of numbers, having been carefully vetted and governed by IT and the business.
On the flip side, Mode 1 BI tools don’t tend to excel at ad-hoc and visualization/data discovery. They are also generally not considered very agile, with the time-to-value from data capture, metadata creation and content delivery often measured in months.
Enter Mode 2 tools: These have more or less everything you need for data analysis contained in a single desktop environment. They are agile, flexible and focus on visual presentations that are beautiful and intuitive. For a while, the pendulum swing went sharply towards replacing Mode 1 tools entirely with Mode 2 solutions.
The problem, however, is that Mode 2 tools can’t do everything. Things like pixel perfect reports, complex modeling, bursting, etc. are not in their wheelhouse—nor their roadmaps.
These insufficiencies left organizations with the conundrum of either sacrificing important functionality or striking a balance by adopting a bimodal approach.
The bimodal divide
Adopting a bimodal approach has the downside of duplicating everything mentioned above in terms of infrastructure, etc. But with the increase of cloud deployments, this duplicative overhead can be minimized somewhat, with much of the burden shifted to cloud providers.
If done correctly, bimodal analytics can drive real business value by supporting all types of analytics, providing both governance and agility. One of the keys to success in bimodal analytics is minimizing the sources of truth. Ideally, each tool should have access to the identical set of curated, governed secure data.
In many companies, Mode 1 users have access to well curated data. Conversely, Mode 2 users go directly to the data sources and export Excel or CSV files. They attempt to recreate often complex metadata in the generally less sophisticated data preparation areas of these tools.
At a minimum, the Mode 2 process wastes valuable analyst time as users sift through hundreds or thousands of tables. As multiple metadata layers and joins and data sources are added, performance suffers. Data quality and integrity become compromised. Having no single source of the truth means numbers don’t align over workbooks. And then there’s the importance of data security to consider as users rely on non-secure extracts and there is limited ability to restrict users access by security level. All of these create risk and add enormous costs to the organization.
Given the wasted time and risks, it seems like a no-brainer to give Mode 2 analysts access to the existing, curated metadata models and reports being used by Mode 1 tools like Cognos. The problem is tools like Tableau and Power BI can’t natively tap into those existing models and reports.
Bridging the bimodal divide
At Senturus, we recognized the market need for a solution that would enable the two modes of BI tools to communicate. In response, we developed the Senturus Analytics Connector, which allows visual analytics tools like Power BI and Tableau to easily connect to Cognos models and reports.
The Analytics Connector creates significant time savings and reduces the cost and risk associated with misaligned, unsecured and/or non-performant data. When Mode 1 and Mode 2 tools work in concert, an organization is more likely to join the top performers that effectively use both standardized reports and data exploration.
Is bimodal right for my company?
Given the advantages of a bimodal environment, it’s a reasonable thing to consider. The question then becomes, which tool combination is optimal? Determining the answer presents an enormous challenge given rapidly changing business requirements and a torrid vendor release schedule that unleashes hundreds of features into the market every year.
It’s difficult, nay impossible, for most organization/IT departments to stay on top of the latest tools and feature updates. But in our job, it’s what we do. To help clients navigate the confusing bimodal waters, we offer a comprehensive analytics tool comparison and recommendation service. In it, we track features between Cognos, Tableau and Power BI and continue to keep vigilant tabs on the feature sets and how they rate and compare. We are completely tool agnostic—meaning we provide an unvarnished, objective perspective on each.
In a world that often celebrates competition and division, it’s refreshing to observe what happens when differing styles of analytics tools work in cooperation rather than in silos or in opposition. Capitalizing on their respective strengths, Modes 1 and 2 work together to bring about richer insights that fuel better business decisions and innovation.