The April 2019 release of Power BI Desktop includes a couple of nice new features for buttons. Buttons are a way to improve your user’s dashboard experience, especially when the data source is a web-based application, such as Salesforce. Prior to this release, Power BI actions could include static web URLs only. The new dynamic Web URL features open up a whole new world of capabilities for Power BI.
In this blog, we’ll take you through a useful way to hook up these buttons with Salesforce data to streamline pipeline review and management. For our example, we will only bring in the Salesforce opportunity table, but a more complex dashboard would likely bring in other tables as well.
Salesforce opportunities
Before we get to the how-to steps, a quick primer on opportunities, if you are not familiar with them. The Salesforce opportunity object is a list of potential or completed sales to your customers. An open opportunity is a possible, future sale of your product or service. A closed opportunity is either won (you made the sale!) or lost (you didn’t ☹). Opportunities and their related data help sales teams manage their potential sales and understand data driving wins and losses.
How to create action buttons in Power BI
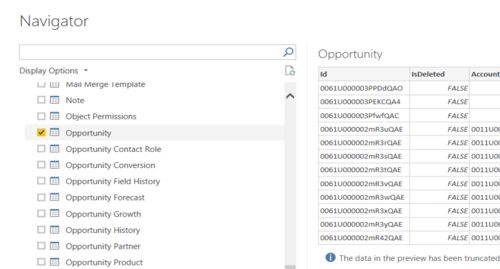
First, we need to create a new Power BI report and connect to your Salesforce data.
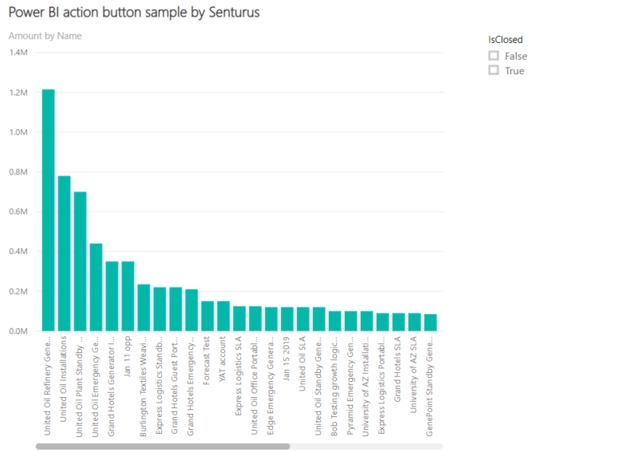
Now, let’s make a simple bar chart on the report using the opportunity’s name and amount. We will also add a slicer to let us pick open or closed opportunities.
Next, we need to create some web URL columns to link back to Salesforce:
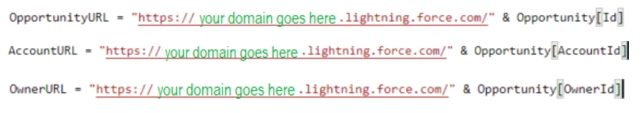
Add the following three columns to the opportunity object, using your Salesforce My Domain. Your Salesforce admin can find the domain name under Setup -> Company Settings -> My Domain. Or, or you can view the base URL after logging into your Salesforce organization.
Create the following columns:
Now we are ready to work with the fancy new dynamic button features in Power BI:
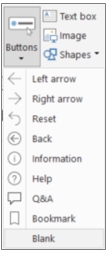
Add a blank button to your Power BI report using the Buttons option on the Home ribbon.
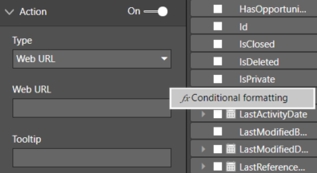
Click the button, give the button a descriptive name (e.g. “View Account”), and then turn on the Action section. Change the Type to Web URL, select the ellipses (…) next to Web URL, then click Conditional formatting.
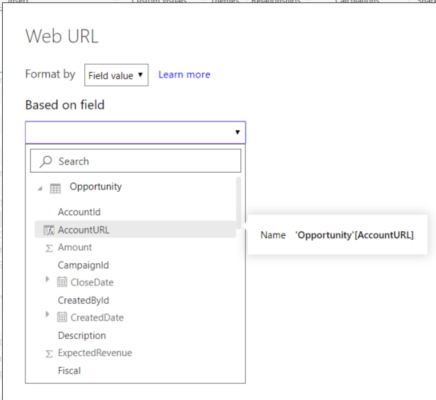
In the Conditional Formatting window, select one of the three URL columns we created above.
Select First for the summarization.
The button is now tied to the selected Opportunity’s Account in our chart! Repeat the above process for the Opportunity URL and Owner URL columns, which we also created above.

And voila! All buttoned up!
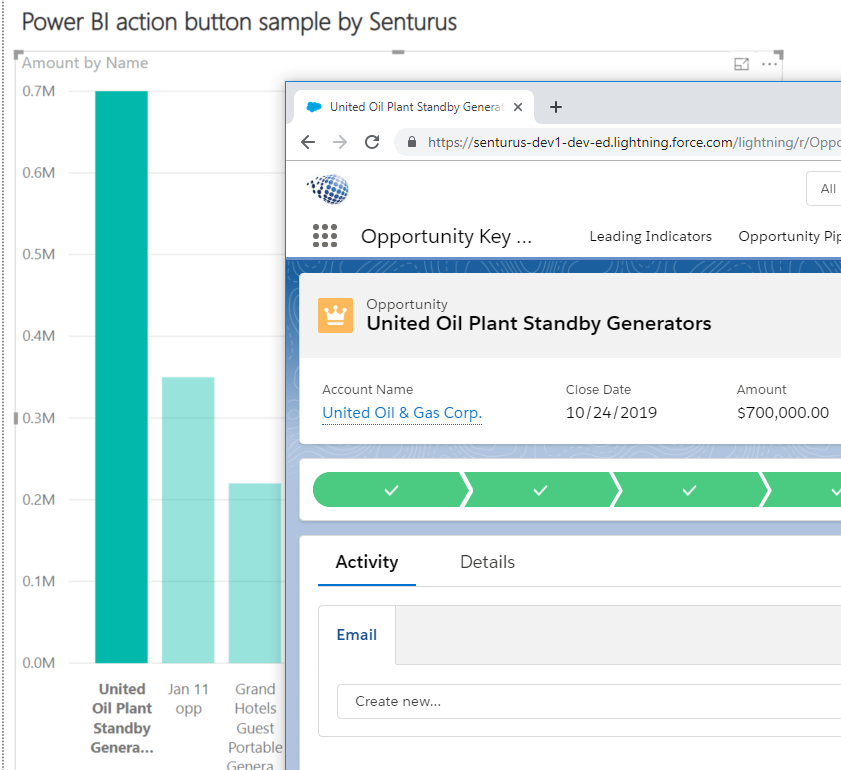
The result is this slick, quick management tool for Salesforce opportunities:
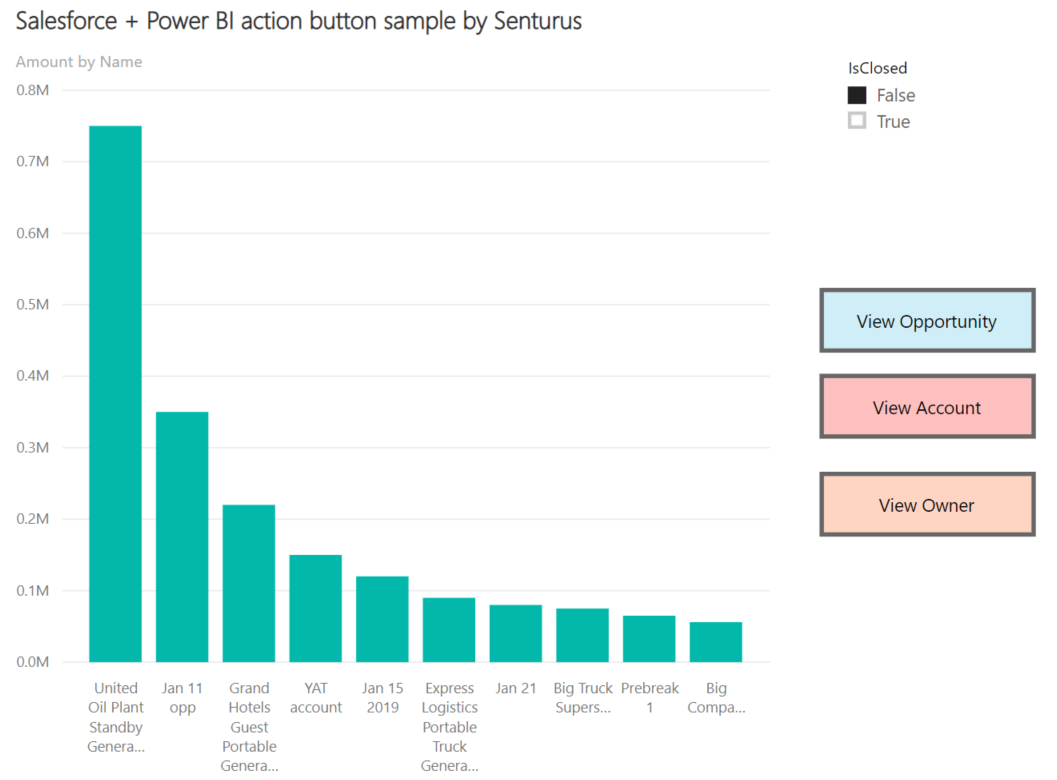
Use Ctrl + Click to test out your button actions: select an opportunity in the chart, then Ctrl + Click the buttons you created. You’ll see the associated Opportunity, Account or Owner page in Salesforce.
Imagine the reporting possibilities
Think about how quickly your sales manager could use this capability to view overall metrics, drill down to an opportunity, update some details and refresh the data source to see the changes reflected instantly! In a large organization, this could be published to Power BI service and coupled with row-level security to give multiple sets of regional and district managers access to just their slices of the data.
The Power BI buttons bring about a cleaner, more straightforward level of integration with Salesforce than was previously available. Buttons offer a visually simple, operationally powerful way to streamline processes and really unlock the value offered by the integration of these two platforms. The simple chart we created just scratches the surface of the types of reporting and button actions you can do with Power BI. Imagine the possibilities!
Need help with some advanced Power BI techniques or Salesforce reporting? Drop us a line. Our Power BI trainers and consultants are happy to help. Or, if you are looking for training on Power BI, we’ve got you covered there as well.