Well, howdy pardner! Pull up a horse and let’s talk about Microsoft’s latest addition to the Fabric landscape: Data Wrangler. Released in November 2023, it is the next evolution of a tool you probably already know and use: Power Query Editor. We are going to familiarize you with Data Wrangler, covering the basic features and functionality, and show you how to use it with some other tools outside of Fabric.
What is Data Wrangler and how is it different from Power Query Editor?
Data Wrangler (DW) is similar in feel to Power Query Editor (PQE), but it includes a good number of new features. The advantage is if you’re a PQE user today, you can jump in, be productive and uncover the new features while still benefiting from Data Wrangler. In addition to a full library of common data cleansing operations, DW provides dynamic summary statistics and a host of built-in visualizations.
The biggest difference from Power Query Editor is that DW is notebook based. By using either Pandas or PySpark, any operation can be saved back to the notebook as a reusable function.
Since most users starting out will most likely be transforming data with Pandas and using DataFrames, we’ll focus most of our attention there. Later in the article we’ll discuss Spark DataFrames and leveraging DW in Visual Studio Code.
Prerequisites for Data Wrangler
The most immediate prerequisite for using Data Wrangler is having a subscription to Fabric. It is a component of the Data Science tab in the Fabric home. That’s it! That’s your prerequisite. Not too challenging or overwhelming. But before you jump right in, there are some limitations to DW you need to be aware of.
Code support. At present, Pandas code is available in general release and the Spark code generation is in public preview. This means that if you want to do custom code operations, they’re only supported in Pandas.
Requires high screen resolution. For most, the bigger hurdle is going to be the DW interface. Microsoft recommends large displays at high resolutions due to the number of panes DW has to offer. While many parts of the interface can be minimized or hidden, if you’re on a smaller screen or have lower resolution, you might not have enough screen real estate to work with DW.
Per the posted specifications for Power BI Desktop, Microsoft is slowly phasing out support for lower resolutions. Anything below 1440 x 900 is considered “too low” to properly use the tools to their fullest. We recommend that your analytics work, whether that’s in Power BI or in Fabric, be done at 1920 x 1080 or higher resolution.
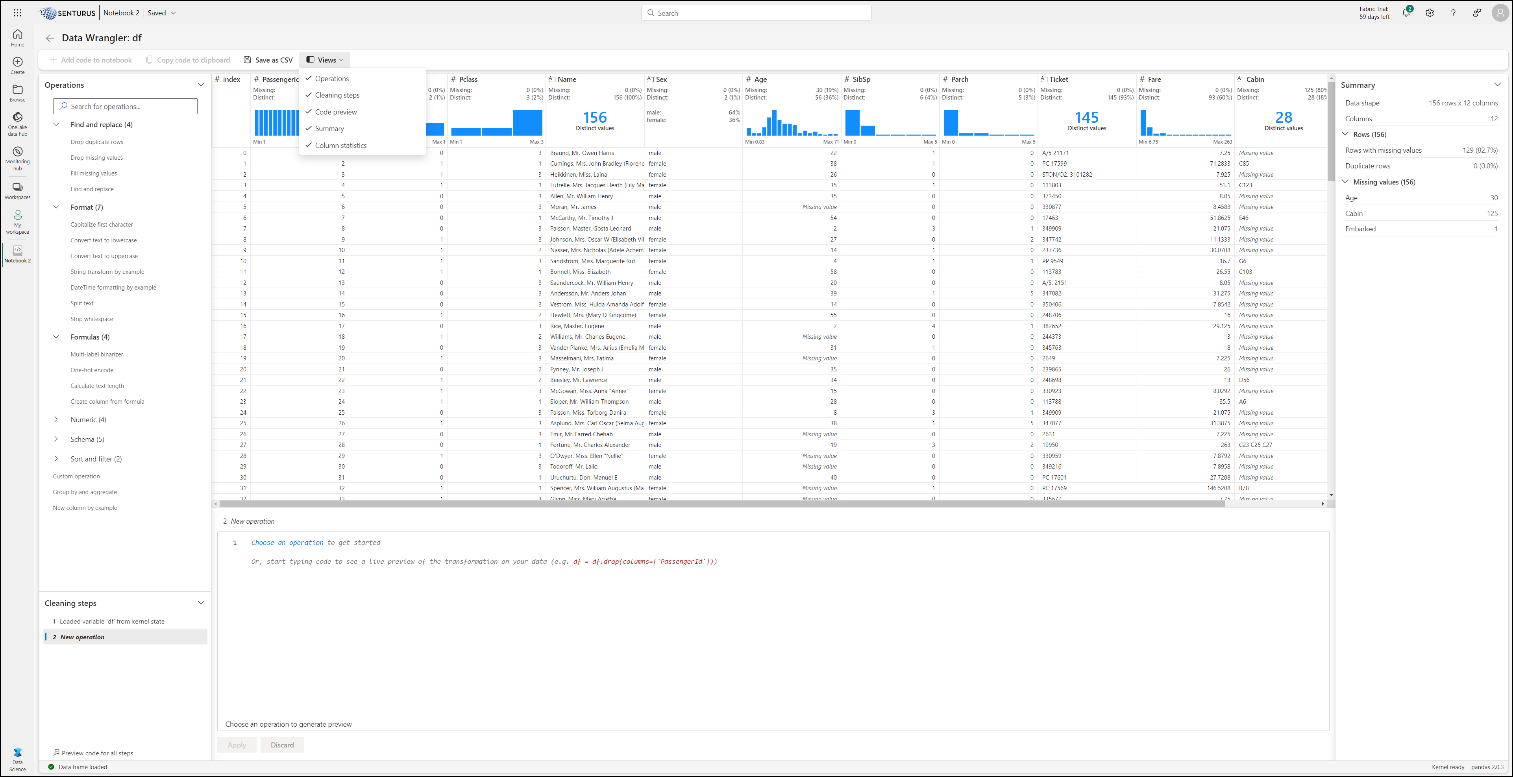
Look at the screenshot below to get a feel for the amount of information DW displays. It shows all the views open:
Starting Data Wrangler
Data Wrangler is accessed two ways. In both cases, it is part of the Data Science container.
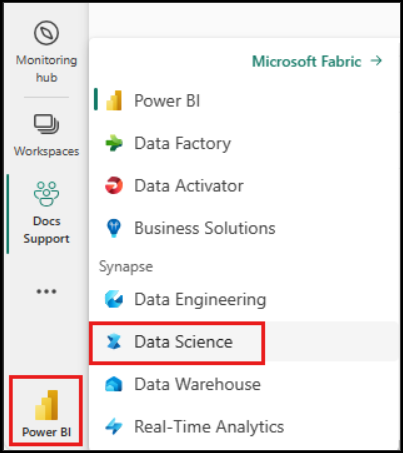
- If you connect to Power BI service environment as your main starting page, you can find it in the bottom right corner under Power BI > Data Science:
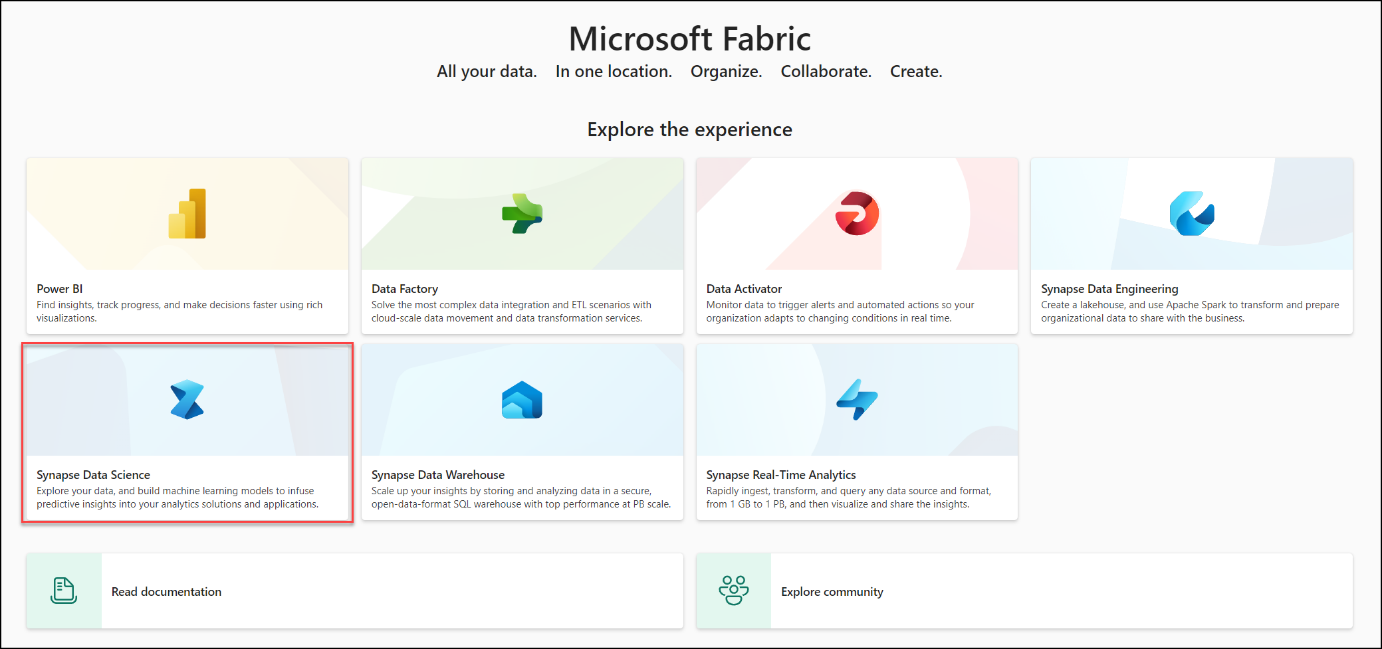
- From the main Fabric page, you can also select Synapse Data Science.
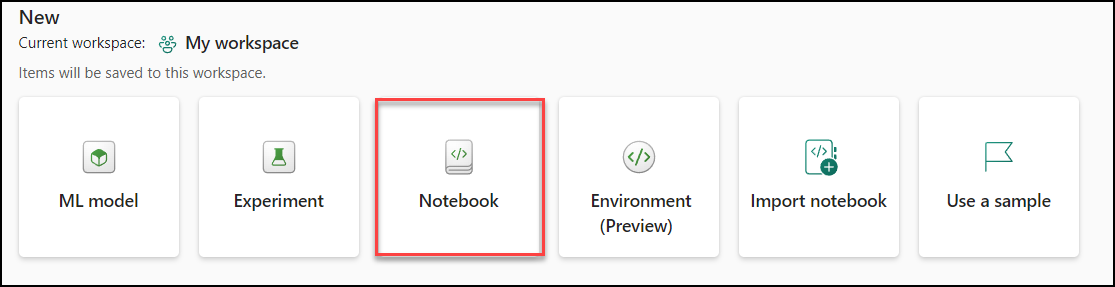
In either case, navigate to the main Data Science screen to select Notebook to start the process:
Features and functionality
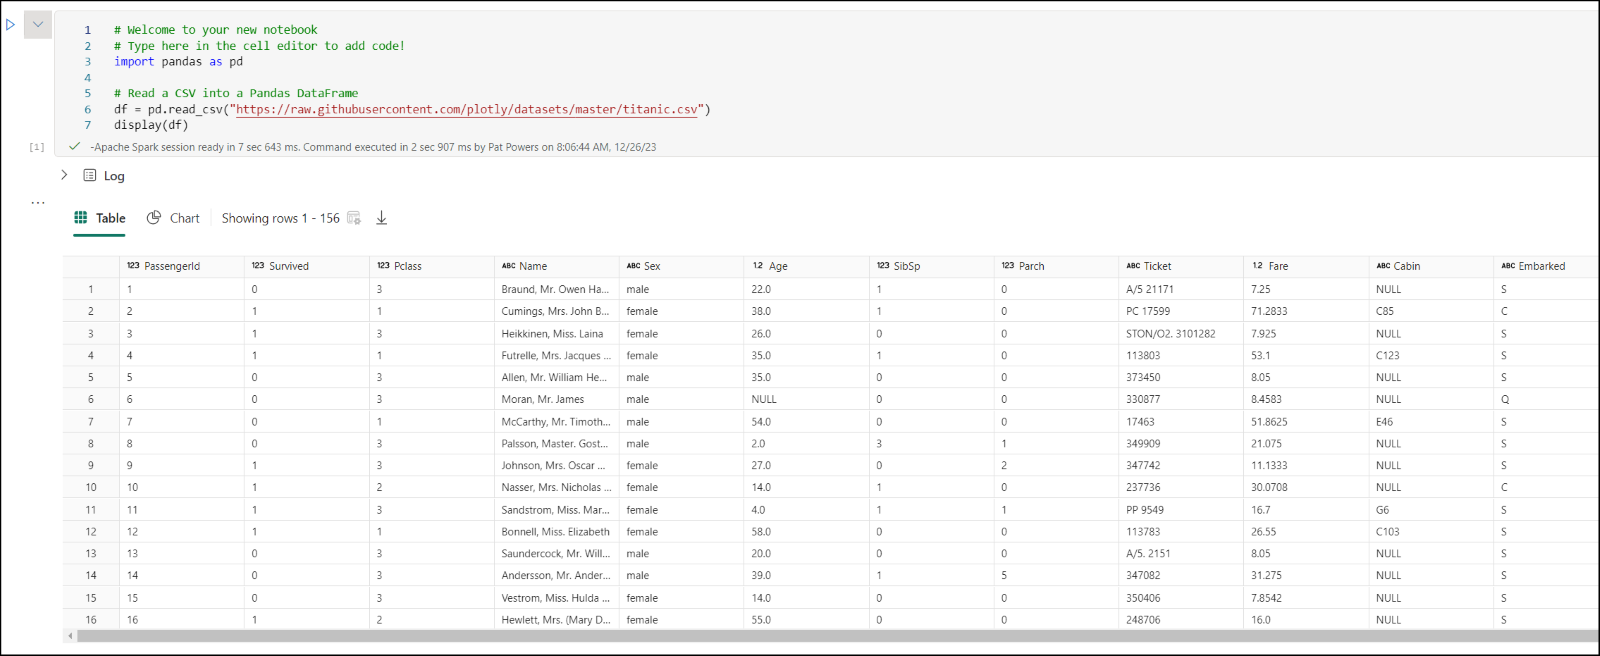
Once you have launched your new notebook, you will need to execute code to bring in a Pandas DataFrame. Below is a dataset from GitHub to show as a sample:
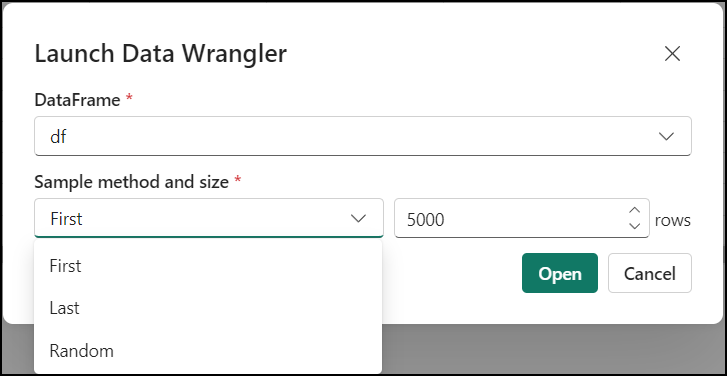
With the DataFrame opened, you now can launch DW from the Data menu. This brings you to the DW interface as seen above. After launching, you can also specify a custom sample of the data from the drop down. This feature is useful if your goal is to do exploratory data analysis.
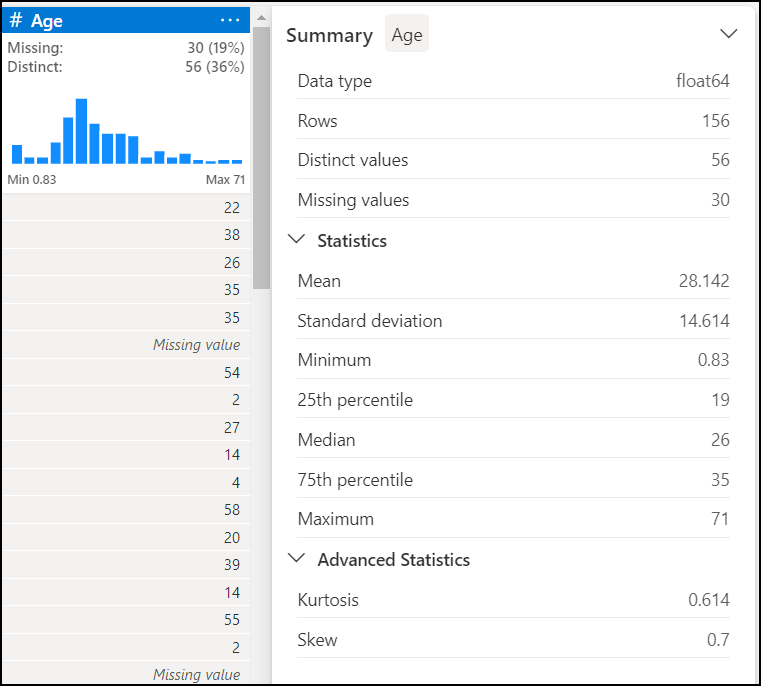
When you first look at your data in DW, use the Summary box to view the top statistics about the data sample. This includes information about the dimensions, any missing values or potential problems with the data that require cleansing. By clicking on a column, you can get more descriptive information about the column and quick insights.
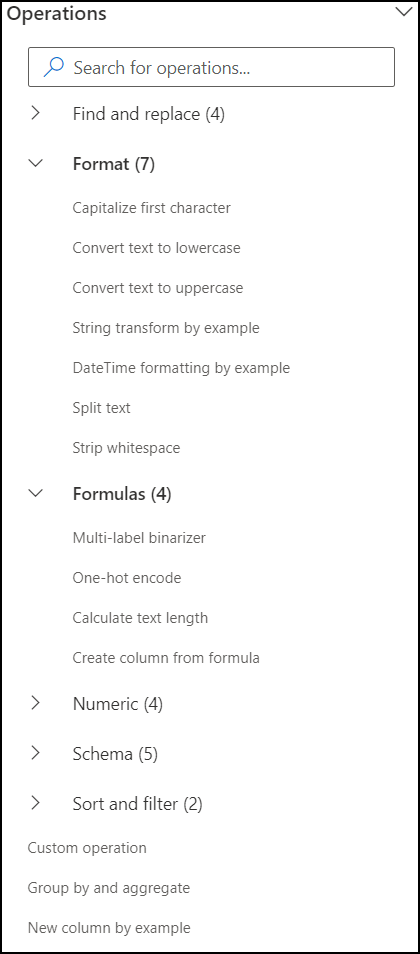
From here you can browse a searchable list of data cleansing steps. These are found in the Operations panel on the left. A subset of these is available from the ellipsis (…) on any column as well.
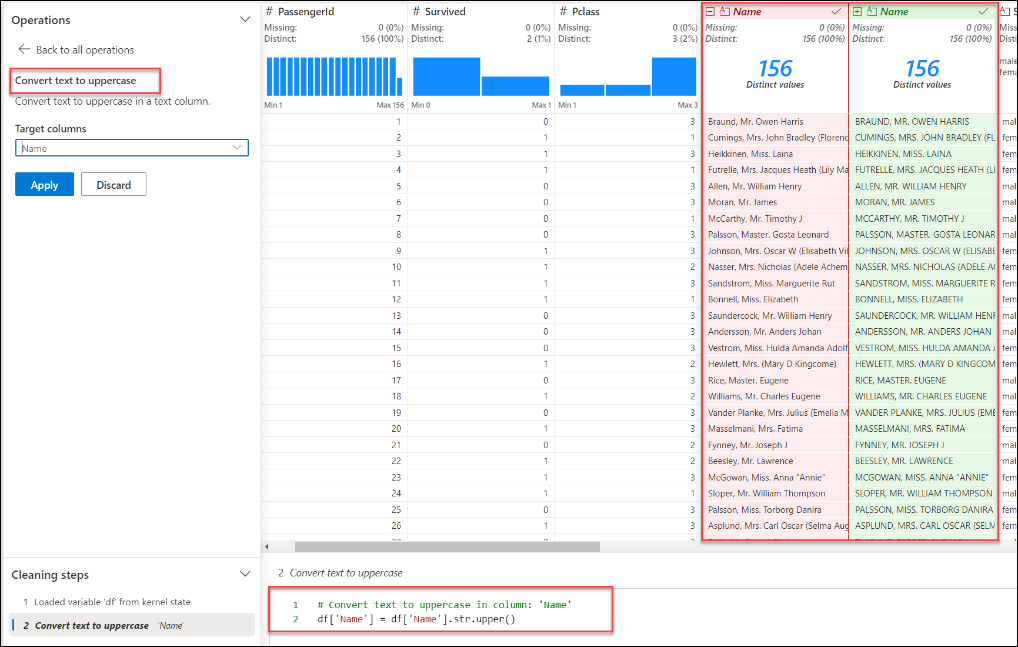
After executing an operation, a preview is displayed in the grid and the code needed to execute is shown at the bottom. You can then choose to edit this operation or use what is there by selecing Apply. You can also Discard the operation and start a new one.
A full list of available operations is available from Microsoft.
After you have completed the desired operation, you can save the code and export it to the notebook as a function. This allows for reusability in the future. This new function is a code cell in the notebook. The cleansed DataFrame can also be downloaded as a CSV file for use in other applications such as Power BI.
Using Data Wrangler in other tools
Speaking of alternate use, DW can also be used with Spark DataFrames. Accessing DW and starting the process is the same, but your code to pull back the data will be different. You’ll be using the spark.createDataFrame function instead. From there, the same statistics and data cleansing operations will be available. You can also save and export just the same as a Pandas DataFrame.
For more advanced use, DW can be integrated into Visual Studio (VS) Code and VS Code Jupyter Notebooks. If you choose to go this path, the prerequisites are more involved including the installation of Python and VS Code. DW is added as an extension from the extension marketplace. Discussing this process will take more space than have we room for in this post. Watch for a more detailed article from Senturus in the future!
Saddle up, data prep for Fabric is here!
Data Wrangler brings the existing PQE desktop experience into the Fabric world. As with all other things Fabric, this functionality can now be accessed online, from a single point of view. Using familiar data cleansing libraries and options, you will be able to prep data just like you do today. DW is also notebook-based, letting you use your existing Pandas and Spark DataFrame code.
All of these attributes, combined with the relationship validation functions, the ability to integrate with VS Code and the ability to save and export your code for reuse makes this an excellent addition to the Fabric landscape. We hope you’ve enjoyed this look into Data Wrangler and are as excited about it as we are.
Whether you’re just starting out with Fabric or have an established environment, Senturus is ready to help. We can supply whatever level of assistance you need, from building out the whole to mentoring you when you have questions. Reach out to us for more details. Ready to get up and running on Fabric? Check out our half-day workshop, Introduction to Microsoft Fabric.