We get a number of questions each week around the proper use of the ATTR() function. Most of them start off with “What is it for??” In this post we hope to explain exactly what it is, why you need it and the practical application of this misunderstood, yet powerful, function.
Learn Tableau. Expert instructors. Advanced topics.
Let’s begin with what it is: the ATTR() function is for the aggregation of dimensions to turn them into measures. You may need to use it when creating calculated fields across blended data sources, for example. It also can be used to test a value to determine if there is more than one response returned. At its core, the function is performing the following test:
IF ISNULL <expression> THEN NULL
ELSEIF MIN<expression> == MAX<expression> THEN <expression>
ELSE “*”
END
Whew! That’s a lot to take in from a single four letter function!
To simplify, if the value of the expression is only one returned value, show that value. If the value of the expression has multiple values, show an asterisk. This can be very useful when checking for duplicates in blended data sources such as looking for duplicate CUSTOMER_ID values:
IF ATTR([BLENDED_DATASOURCE].[CUSTOMER_ID]) = “*”
THEN “TRUE”
ELSE “FALSE”
END
In this scenario, when there is one and only one customer ID returned, our expression will be true. Otherwise we will return a false value. This calculated field can be used as a filter to help reduce bad data.
It can also be used directly on a visualization to see if there is a unique value or multiple values returned for a row. Using the same logic as above, we can see if an Order Number has been incorrectly assigned to multiple customers.

Example Using Tableau 10.2
We will open up Tableau 10.2 and work through the steps for this exercise. This exercise starts with Tableau being open, US Sample Superstore as the data source and the Orders sheet being brought in on the data page. This version of US Sample Superstore has been modified to have a row with duplicate values. You would need to edit your version of the file in a similar fashion for this to work.
- Begin a new worksheet and in the data pane, right-click Customer Name and select Duplicate. Rename this Customer Name (ATTR).
- Right-click the new Customer Name (ATTR) field and select Edit. In the expression editor, wrap the Customer Name field with the ATTR function:
- ATTR([Customer Name])
- Click OK. Notice that this field has now moved from the Dimensions pane to the Measures pane. This is because ATTR is an aggregate function. Any field that is or can be aggregated will show up under Measures.
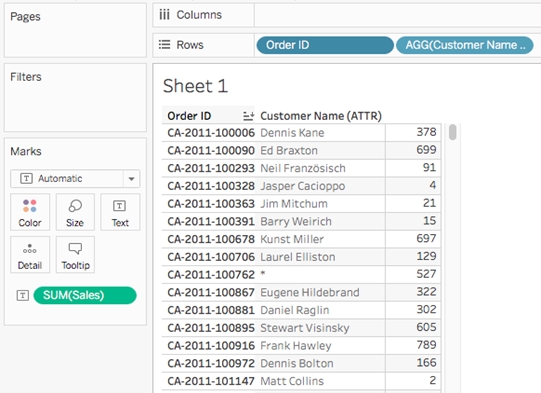
- Drag Order ID to the Rows shelf. Add Sales to the Text Here, we see the aggregated amount for each order by Order ID.
- Hover over the Order ID column on the visualization and click the Sort icon to sort this column ascending by Order ID.
- To test our hypothesis of order numbers being re-used, we will add our new Customer Name (ATTR) measure to the rows shelf to the right of Order ID.
- As anticipated, we do see Order ID CA-2011-100762 shows an asterisk (*) for the customer name whereas all other columns return a single value. This tells us that ATTR was unable to return only one row for that Order ID.
While this doesn’t tell us how many customers are assigned to the given order number, nor their names, it does provide us with a starting point for our investigation. We can leverage this information and dig deeper into the data.
This is but one of the many uses of the ATTR function. Remember, if you have blended data sources, you must use ATTR as all values in a blended calculation will be aggregated. In our Tableau Specialized Visualizations half-day training course, we discuss when and how to use the ATTR function.
Learn Tableau. Expert instructors. Individual & corporate training.