Chuck Hooper, former head of Tableau’s consulting organization and Senturus lead Tableau trainer, outlines what to do when your Tableau forecast is rendering as a straight line.
Scenario:
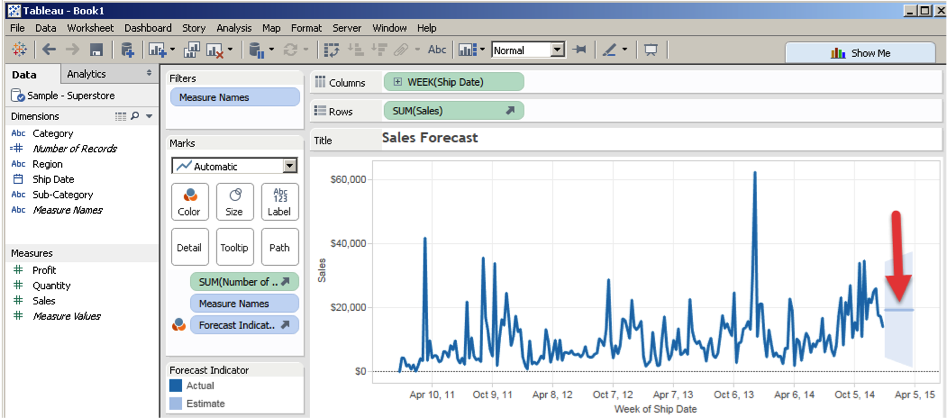
You build a line chart, showing value over time. You tell Tableau you want a forecast, but the forecast is a straight line. How do you fix it?
Solution:
- Right click in the view, select “Forecast,” then select “Forecast Options.”
- Set the Forecast Model dropdown to “Custom,” and set the two dropdowns below it (Trend and Season) to either “Additive” or Multiplicative”(note, both must be the same).
- Click “OK” to see the new forecast.
- In the options dialog, click “Learn more about forecast options,” to understand more about why this is necessary (note, if you are not a stats person, you might want to skip this link).

Get a free, 14-day full version trial of Tableau
Interested in learning more about Tableau? Our on-demand webinar Tips for Tableau Beginners highlights tips for dashboard design with Tableau Desktop and how to use Tableau to take raw data and quickly make engaging, actionable visuals. Learn how to connect to various data sources and core techniques for visualizing data using the Tableau canvas.
Need additional Tableau training? We beginning and advanced instructor-led, online courses as well as self-paced, onsite and custom training.
Chuck Hooper’s career includes over five decades of business and IT experience. He started Tableau’s Professional Services consulting organization and was a Tableau Zen Master from 2012-2014. He conducts training sessions on the use of Tableau Software products, and does speaking engagements on visual analytics, data warehouse design, and other business intelligence topics at both the technical and the executive levels.