Frank Lloyd Wright famously said you can either use an eraser on the drafting table or a sledge hammer at the construction site. This same statement about architectural design applies to planning out a business intelligence solution. You can put the time to thoughtfully think through the business requirements, build a team of cross departmental thought leaders and thoroughly document each phase—or you can wring your hands downstream, bemoaning why your expensive BI project isn’t working.
In our experience, people too often rush towards the implementation stage, skipping over the much needed diligence required well upstream of implementation. They choose the BI technology and let that drive the solution that gets created.
But good BI is not about the tools. BI failures are due to bad decisions and inadequate upstream diligence, not bad technology. Projects get delayed, or go completely off the rails, due to the lack of having the right supporting people and structures in place.
To achieve success in BI you need a thought leader who will think outside the box and consider the solutions that pertain uniquely to your organization. You need knowledgeable personnel to filter the many possibilities through the lens of experience. And…you need the unsung hero of good BI: solidly authored documentation that captures the business requirements and architectural needs.

Not sexy but…
We cannot overstate the importance of documentation in a BI build out. Good communication, in the form of well scoped documentation, is critical to success. If you’re not all singing off the same song book, then you’re not going to be able to execute well.
State and document on paper that can be reviewed and signed off by stakeholders why you’re building a solution and what is it supposed to do. People are often willing to jump in a design without stating and signing off on requirements. That’s a problem both from the management side and the solution designer side. In this blog we look at several foundational “upstream” documents. Importantly, all these documents are written without any particular tool in mind.
First up: business requirements
A business requirements document (BRD). Since data informs every stage of the process, you want to get the BRD involved as soon as you can by capturing the story of the business needs. But make sure to do so from a data centric and tech agnostic point of view.
The BRD addresses questions about who the data will be presented to and why this data matters. It does not try to capture the high level of what the business is about, nor does it try to determine the technical solution. It is a business solution document.
A bus matrix. The bus matrix is a high level, cocktail-napkin-type sketch of the BRD that lets you capture what business processes you’re going to measure and how to categorize them.
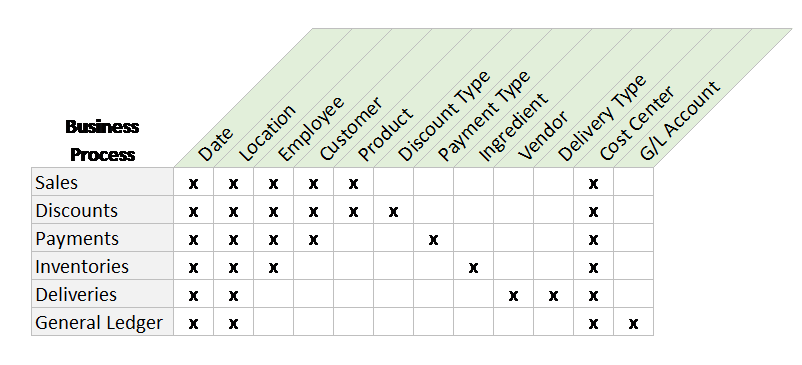
In this sample of a bus matrix for a restaurant chain, the business processes appear on the left, e.g. sales discounts, payments, inventories, etc. Across the columns are the categories for that information. An X indicates where those things intersect.
For instance, Sales can be analyzed by date: day, week, quarter, year. In other words, anything that pertains to time. And Location could mean the store, but also the region, district, zone or whatever way you organize your business. And so on.
Again, the bus matrix shows how you are going to categorize and slice information at a conceptual level. You’ll get down to brass tacks in the modeling phase.
Next up: architectural needs
An architecture summary. The architecture summary is a technical response to the BRD, outlining how to respond to those nonfunctional requirements. It draws bright lines back to the BRD, answering questions like: how are we going to present that data? How are we going to respond to those nonfunctional requirements? How are we going to fulfill the use cases that were detailed? As with the BRD, this document is tool agnostic. The architecture summary addresses all requirements and use cases provided and recorded by the business.
The architectural summary should be written in plain English, without jargon. Analysts should be able to read an architectural summary and feel confident that the system is going to make sense to them. It’s devoid of the technical development details like IP addresses and server configs…that comes later. If you get agreement and sign off in this phase, you should hopefully save lots of time, money and wasted effort down the road.
A data flow diagram. This diagram is a high-level illustration of all the components you’ll need from a data/user perspective (not the technical tool/platform perspective). It outlines the business important processes and how they are going to get to end users.
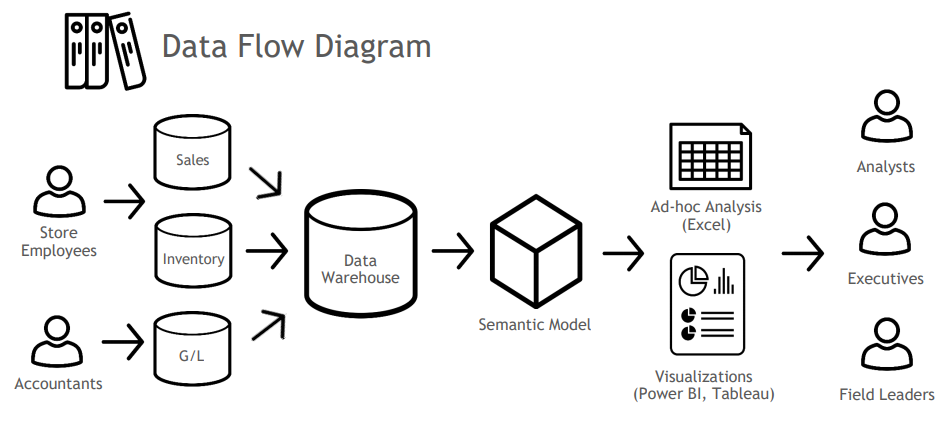
Remember, we’re staying very data centric; we’re not talking about platforms yet. The data flow diagram should be a one page document—a vizio diagram—that shows the story of the data flow, addressing what is it, what the important business processes are and how they going to get to end users.
Looking at the example above, on the left we start with the people who are executing business processes. That flows into the systems of record, which flows into the data warehouse, then into the metadata semantic model and finally into some sort of analysis visualizations to these use cases. Again, we’re drawing lines back to the BRD.
Style guides. Without good report design, all that work upstream is wasted. Take time to think about how you want to present data. This document captures what colors to use for what items, defines fonts and headline styles, what data will be represented as bar charts, pie charts, etc.
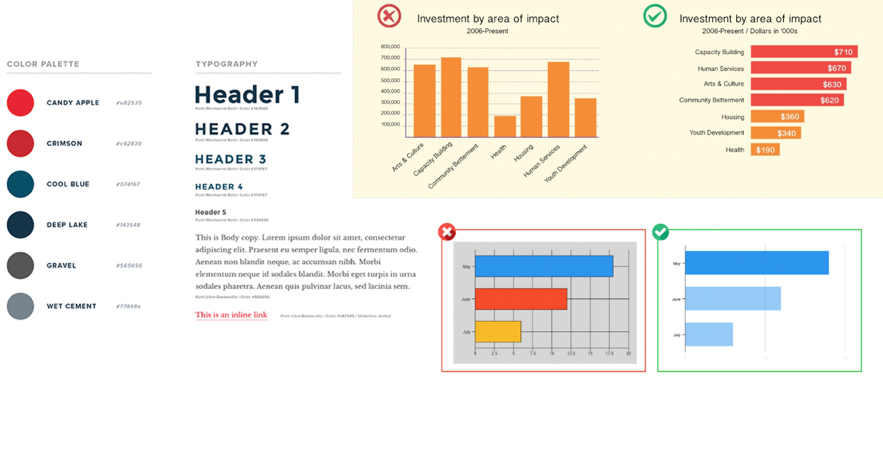 Some basic understanding of color and layout in terms of their visual and psychological effectiveness can be helpful. For some great tips and best practices on the science of good dashboard design, check out our on-demand webinar with Senturus CEO John Peterson.
Nuff said…for here
Hmmm…you may be thinking…enough with all the documentation! (And we didn’t even touch on some of the technical documents.) But we promise you, the attention paid here will pay big dividends during development in terms of time, money and effort saved. You won’t need to pull out the sledge hammer, go back to the drawing board or be a statistic of BI failure (according to Gartner, 70-80% of BI projects fail). Instead, you’ll have satisfied analysts and end users because the BI system you implemented will meet end user expectations and it will get used. And that is the ultimate sign of successful BI.
If you’d like to learn more about our perspective on what leads to great BI, you’re in luck. This blog is taken in part from a Senturus on-demand webinar, Great BI: It’s Not About the Tools. See the entire, informative recording.