AI in BI
As artificial intelligence (AI) technology becomes more mainstream and refined, we’re beginning to see vendors embedding AI capabilities into their business intelligence (BI) platforms. Consequently, AI features have become more accessible, easier to use and easier to share with others. We’re also seeing more powerful BI systems that can prove their worth in a shorter period of time.

The lure and limitation of AI
One of the features of AI-aided-BI is the ability to uncover hidden relationships in your data. It assists analysts in finding and displaying strong data correlations they might not otherwise uncover. For example, insights like “Your highest profit customers buy most often on Tuesday” might lead to staff scheduling decisions and reinforcing upsell techniques on that morning. Uncovering those types of hidden insights to unlock revenue or speed up processes is the promise of AI.
However, one current drawback with AI is its lack of a human’s common sense. Sometimes the correlations AI draws are obvious and unhelpful. Absurd insights like “100% of customers living in the city of San Francisco also live in the state of California” while highly correlated, just add noise. Power BI, Cognos and Tableau all suffer from this lack of common sense at times. Teaching AI to have common sense will be a very challenging problem for BI vendors to solve.
As a partner of IBM, Microsoft and Tableau, Senturus is uniquely positioned to objectively assess the performance of each platform. While Tableau, Power BI and Cognos all offer methods to integrate R and Python for complex, data-scientist-driven machine learning (ML) and AI, for the purposes of this blog, we’re focusing on the bundled AI offerings the vendor provides that targets end users.
Testing AI in Cognos, Tableau and Power BI
In our assessment of the three platforms, we will be covering the following AI capabilities
- Power BI made the key influencers visual generally available with its August 2019 release. We tested with the September 2019 release.
- Tableau’s Explain Data feature was released in September 2019 with version 2019.3. We tested with version 2019.4 which includes Explain Data improvements.
- IBM released Explorations with Cognos Analytics 11.1 in September of 2018. This feature has continued to improve with each subsequent release. We tested with 11.1.4.
The test criteria for our comparison
While similar, these BI tools take different approaches to applying AI and uncovering insights. To compare them in a somewhat similar way, we’re going to start with the same data set: the Wide World Importers data set, a popular set of demo data provided by Microsoft. We previously used this same data set for our popular BI dashboarding comparison on-demand webinar. The database is hosted as an Azure SQL database and we’re using the data warehouse (DW) version of the database.
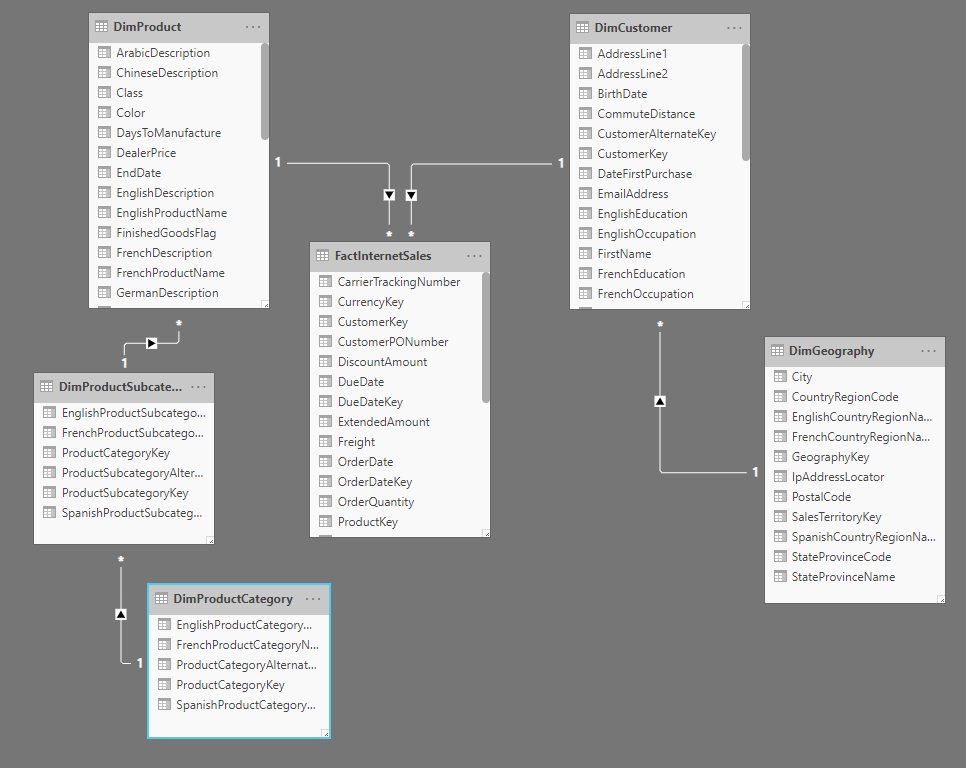
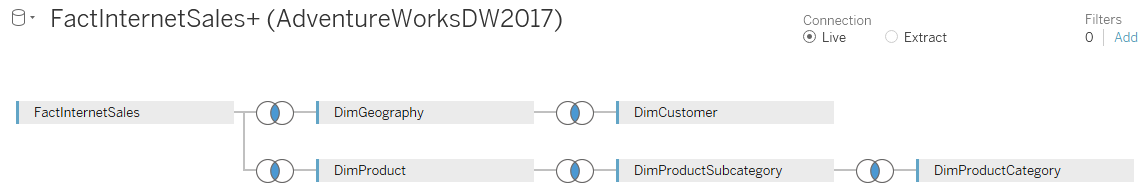
We will focus on a subset of tables from this dataset that already have relationships established at the database level
- FactInternetSales
- DimGeography
- DimCustomer
- DimProduct
- DimProductSubcategory
- DimProductCategory
Otherwise, the tools will dictate how we pull in sample data for the AI features to use.
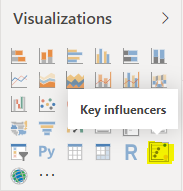
Power BI’s key influencers
Power BI embeds AI using a dedicated visual that you add to a report.
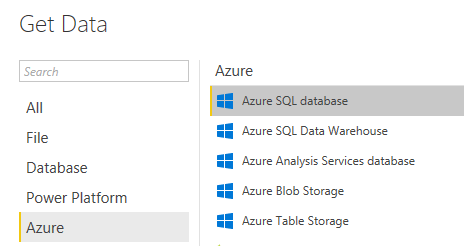
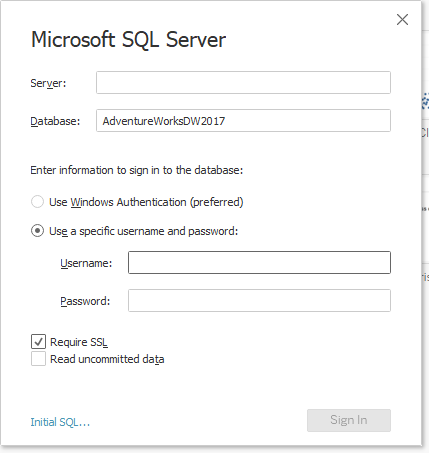
To begin, we use Get Data to connect to our Azure SQL database using a live connection.
After providing connection information, metadata imports into Power BI Desktop. We can view the data model on the Modeling tab.
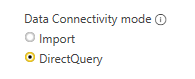
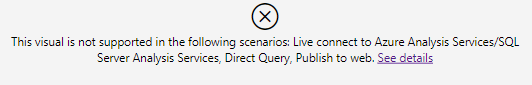
However, after adding the key influencers visual to the report, we discover that we must import our data into Power BI to use the key influencer visual. Live queries via DirectQuery are not currently supported.
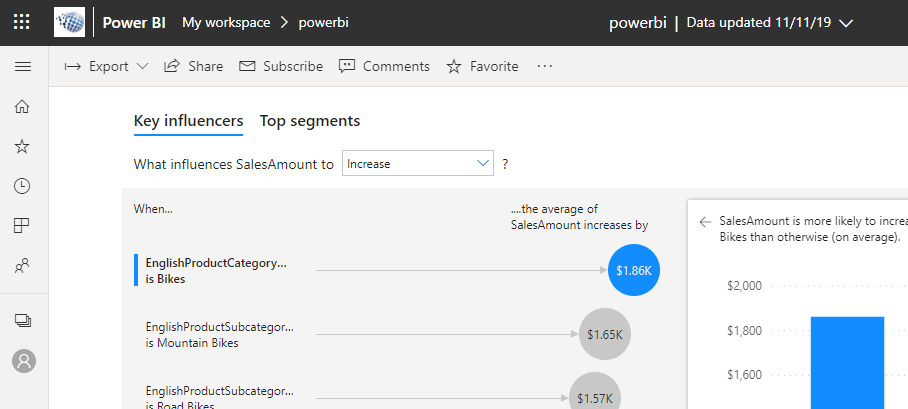
After we swap the data set to Import mode and the data imports locally, we can begin to use the key influencers visual in the report. We tell the visual what measure to analyze (SalesAmount) and then drag various dimensional attributes into the Explain by section to uncover correlations.
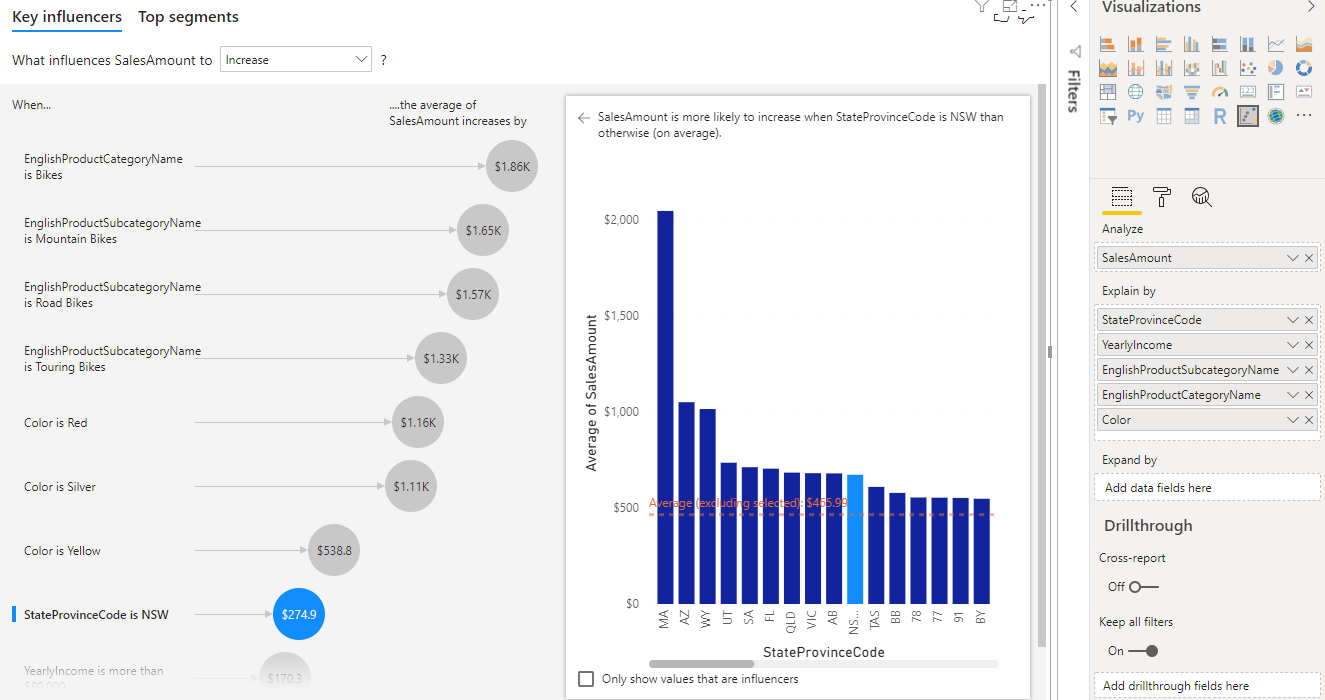
This process is very ad hoc; some dimensions uncover new insights while some do not change the results at all. We tested a series of different columns, bringing them into the Explain by area to see what changed, if anything. Insights were a mixed bag of beneficial and those lacking common sense and therefore unhelpful.
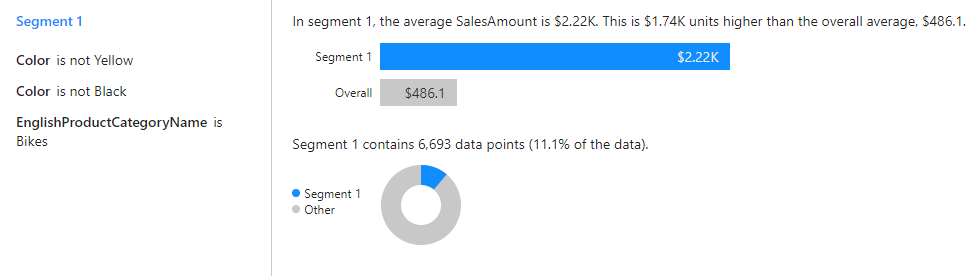
Key influencers also can detect segmentation, as seen on the second tab.
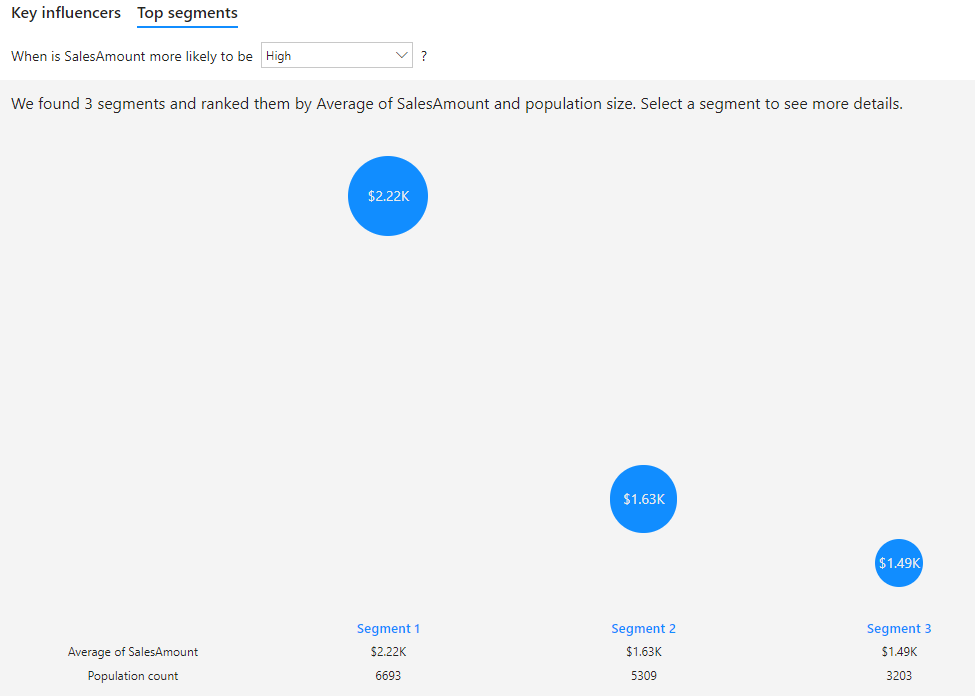
By clicking on Segment 1, we can gain some further insight into what makes up that segment.
Lastly, Power BI Pro users can publish the visual to Power BI service to share with others.
Overall, Power BI has a ad hoc, user driven feel to it. The AI will do the processing, but the end user needs to present it with ideas.
Pros: You can quickly toggle dimensions to see what effect they have. Automatic segmentation is a nice and unique feature the other tools don’t offer currently. This approach can be done locally using the free desktop tool before purchasing a license to share.
Cons: Manual work is needed to call the AI processing. DirectQuery isn’t supported, so large datasets will need to be imported locally. Unlike Tableau and Power BI, generated visuals cannot be copied into a new report for further exploration.
Tableau’s Explain Data
To begin testing Tableau’s AI features, we’ll first connect to the Azure SQL database, providing standard database connection information.
We then select the tables we want to review. Unlike Power BI and Tableau, the table selection order matters. For example, don’t select DimProductCategory before selecting DimProductSubcategory as you’ll be prompted to specify the join. The other tools pull metadata at the end of the table selection process and don’t have this issue.
Next, we need to build a visual as a starting point before we can use Explain Data.
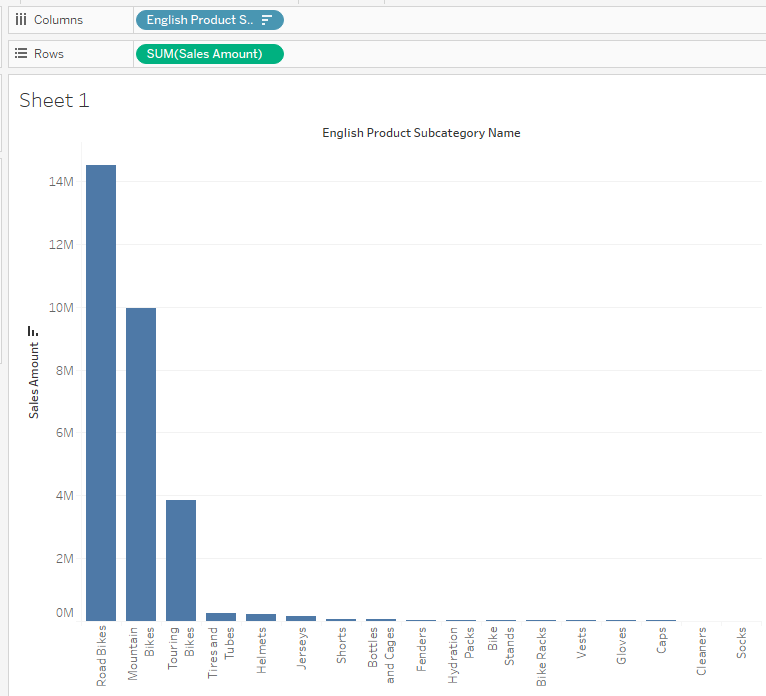
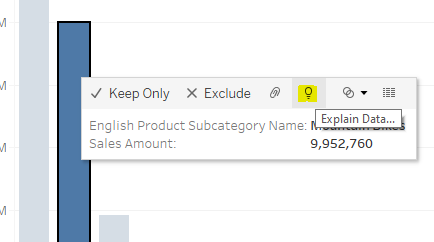
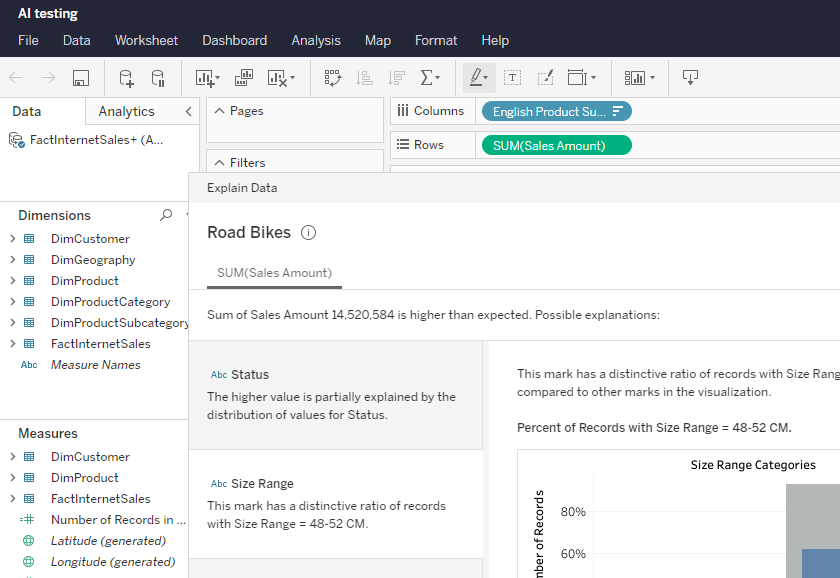
Now, clicking on a data slice, the Explain Data button in the tooltip can be used to run the AI processing.
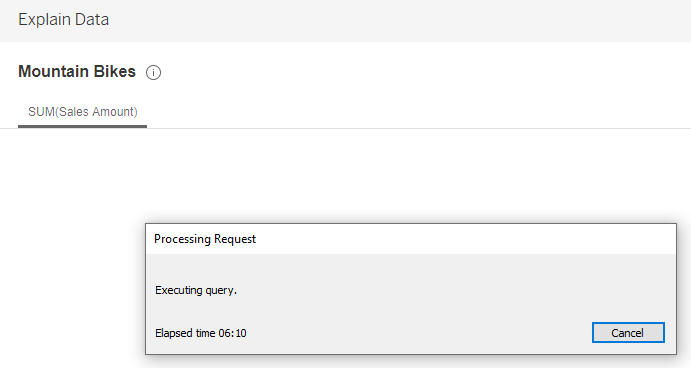
In our experience, the AI processing caused some long queries to run against the database. Tableau is doing the heavy AI lifting at this point, detecting correlations. It was noticeably slower than Cognos and Power BI using the same database, high-speed network and desktop system.
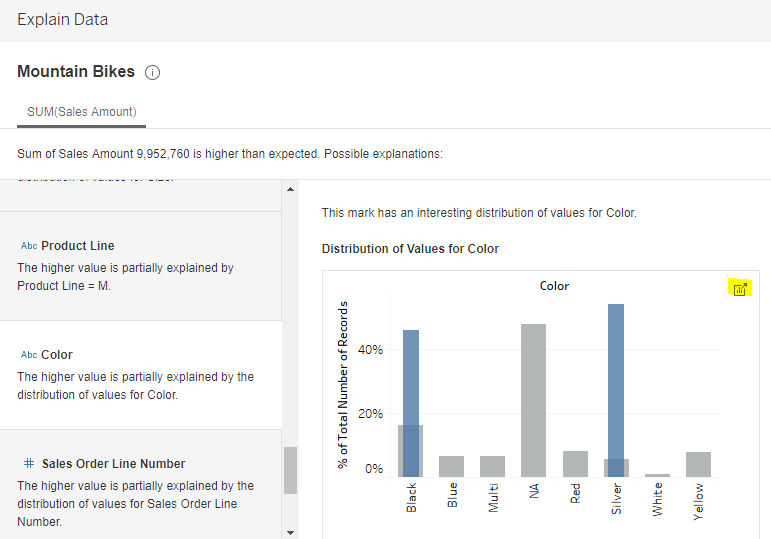
Once the query completed, the AI analysis is presented. Several of the results were unhelpful, but some were insightful. When you find something interesting, you can click the highlighted icon and view and edit the visual in a new worksheet, which is very handy.
Completed workbooks can be published to Tableau Server or Tableau Online so that other licensed users can use the Explain Data feature via the tooltips. Those users will need an Explorer or above license to use Explain Data, and they must edit the spreadsheet to see the tooltip option.
Pros: Explaining a data mark to a user using AI seems useful and intuitive as analysts are already used to using tooltips and selecting marks. Live queries are supported (but fairly slow), extracted data is performant.
Cons: This approach is less exploratory in nature due to needing to first build a visual. Viewer licensed users cannot use Explain Data, only Explorer licenses or above while editing the workbook.
Cognos Explorations
With Cognos Explorations, you need to start with a data module. However, getting to a Cognos data module from a database connection is a bit involved if it isn’t already setup in Cognos. Tableau and Power BI are lightyears ahead of Cognos in this ad hoc data source setup arena.
First, setup a new Data Source Connection.
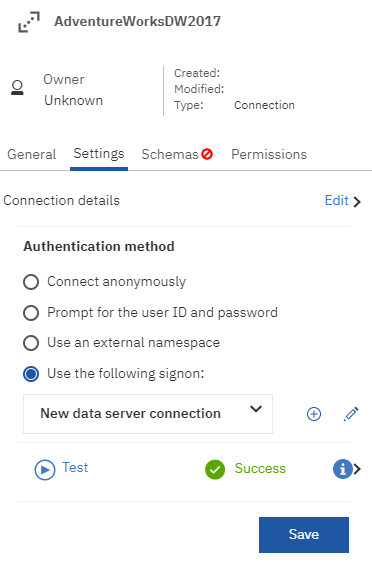
Next, load the metadata for the schema. This process is not intuitive. It is buried under Data Source → Connections → Schemas.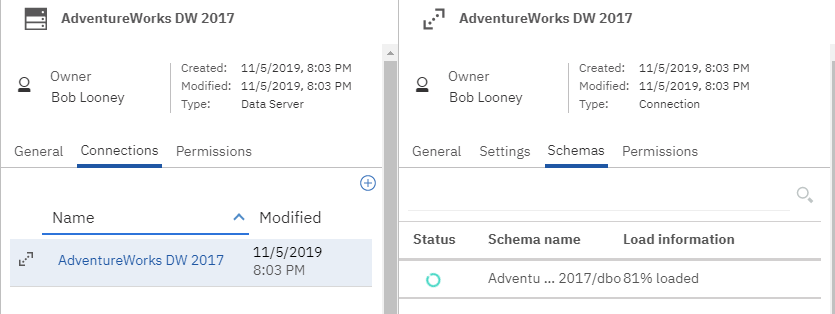
Then, create a new data module, selecting the Data server and the schema.
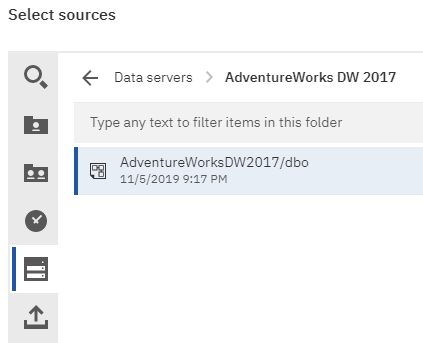
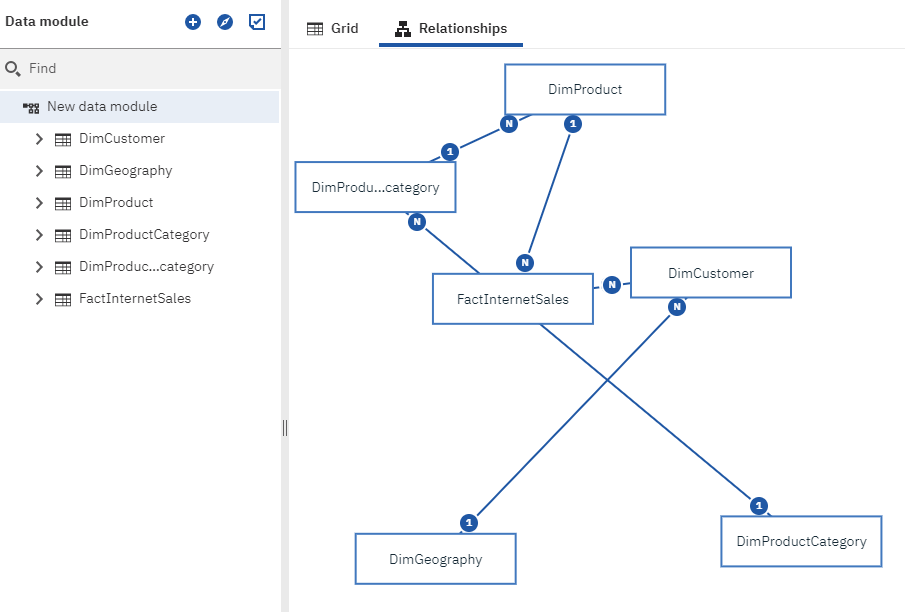
As part of building the data module, you select the desired tables. Like the other BI tools tested, relationships are detected and diagramming is supported.
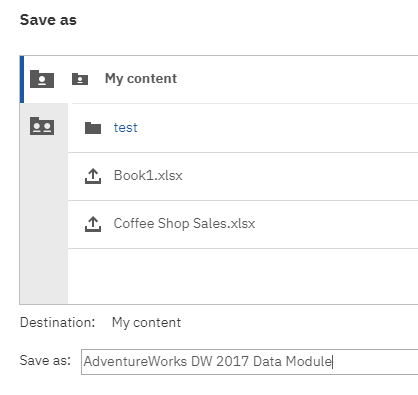
Next, save the data module somewhere accessible.
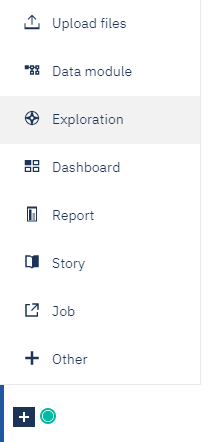
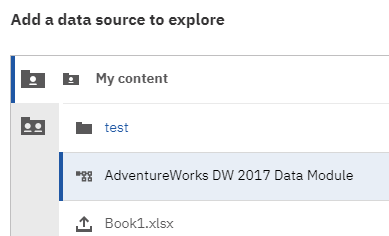
We’re now ready to start an AI driven exploration on the data module. This is where Cognos really shines. We go to New → Exploration, then select the data module that was just created.
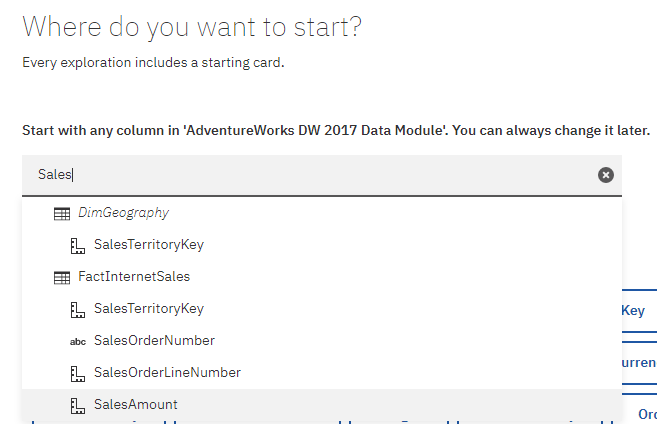
We are then prompted to pick a metric with which to start our exploration. As is the other test examples, we will pick SalesAmount using the nice autocomplete list.
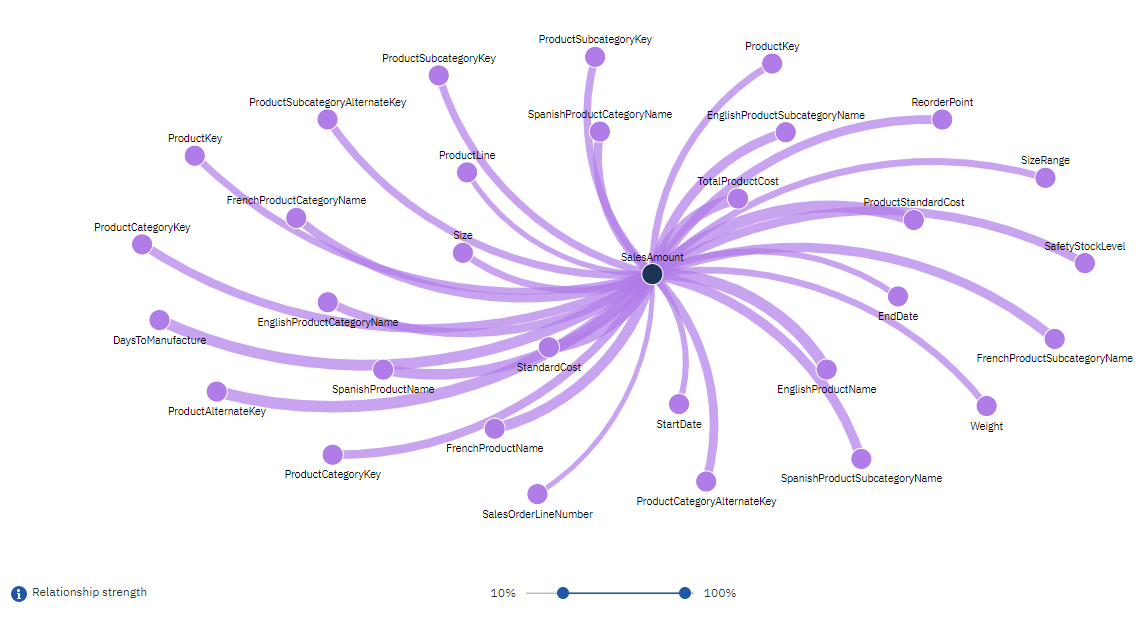
Cognos will query for a few moments, then show an initial view of the data. Using the “Relationship Strength” slider at the bottom, we can reveal more or less options that are more or less strongly correlated.
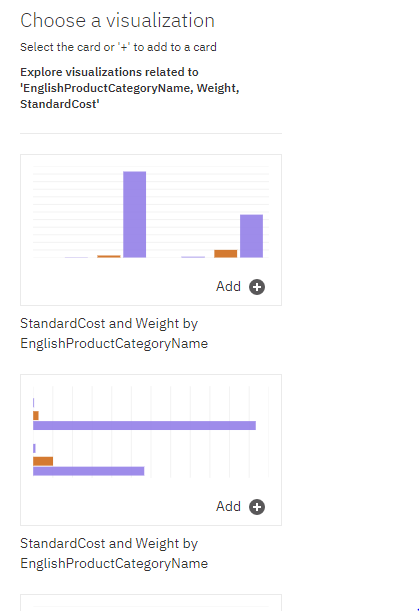
From this point, we can click on one or more data points, then pick from several AI generated visualizations to keep exploring.
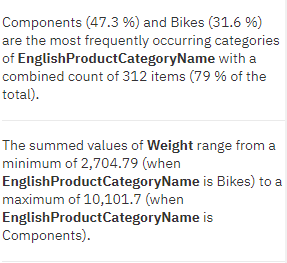
Then we start seeing some textual explanations of correlations. This process of selecting data points and viewing additional auto generated visualizations can be repeated as desired.
Explorations can be saved and shared with others in your organization.
Pros: AI does the heavy lifting, generating visuals with minimal user input. Auto generated visualizations give quick, visual options. Live query performance on our low resource demo system was solid.
Cons: Setting up and connecting a new database data source is very clunky.
Summing up AI in Cognos, Power BI and Tableau
Power BI, Cognos and Tableau all have some flavor of built-in artificial intelligence, but none of them fully remove the analyst and his/her knowledge from the equation. As is the trend with automation, AI will serve to assist users, not to replace them. As these AI capabilities continue to evolve and expand, expect to see more helpful insights and fewer nonsensical results. The real proof is testing these against your own data and seeing what your system reveals.
Where ever your organization is on its BI journey, Senturus can help. We work across the entire BI stack and are tool ambidextrous, with complete fluency in the three best platforms: Cognos Analytics, Power BI and Tableau. From big picture strategy and end-to-end implementation to staffing and training, Senturus provides the expertise to ensure your success. Contact us for a free consultation.