Power BI has some great built-in features like field parameters, measure groups and row-level security. But how about when you need to do something a little outside the box? Let’s say you want to get behind the scenes of a query and do more complex things with it, a common scenario for many advanced Power BI users. Enter Tabular Editor.
Tabular Editor (TE) is a third-party tool that lets you go under the hood of your Power BI reports. Providing direct access to the queries and tables, it helps you to do more than you can straight from the Power BI interface.
In this blog post, we show how to build a calculation group and implement object-level security using TE.
What is Tabular Editor
Tabular Editor allows developers to change and modify the backend query of a PBIX file. It’s an editor alternative for doing DAX, managing measures, using calculated columns and more in either Power BI or Analysis Services.
The product is available as two different editions: Tabular Editor 2 (TE2) and Tabular Editor 3 (TE3).
- TE2 is an open-source free version that can handle many tasks users might want to do such as DAX, batch renaming and a deployment wizard.
- TE3 is a commercial product with licensing fees. It is the next evolution of the product.

Refer below to the feature overview chart below for an outline of the feature differences between the two editions.
Notes:
- For the examples we show in this blog, we used TE3.
- Some TE3 features are available with different licensing, learn more.
- See a full feature comparison between TE2 and TE3.
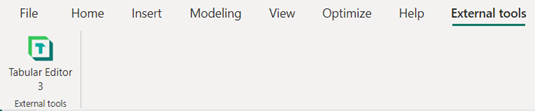
After Tabulate Editor is installed, it will appear in Power BI application under External tools:
Calculation groups
It is not uncommon to use the same measure in multiple calculations on a visualization. For example, you might want to show a sales figure as well as the MTD, QTD, YTD, PMTD, PQTD and PYTD versions all on the same page and in the same table or matrix. You might also need to show Profit, Avg Profit, and Median Profit on a single visualization. Having this many measures can lead to a model with way too many fields to navigate.
One way to avoid this issue is to use a calculation group. A calculation group allow you to create a table with a measure name. When that measure name is dropped onto a matrix, it will show all the variations defined in the grouping.
To build a calculation group, start by opening Power BI with the dataset to which you want to add the group. From there, go to External Tools and start Tabular Editor.
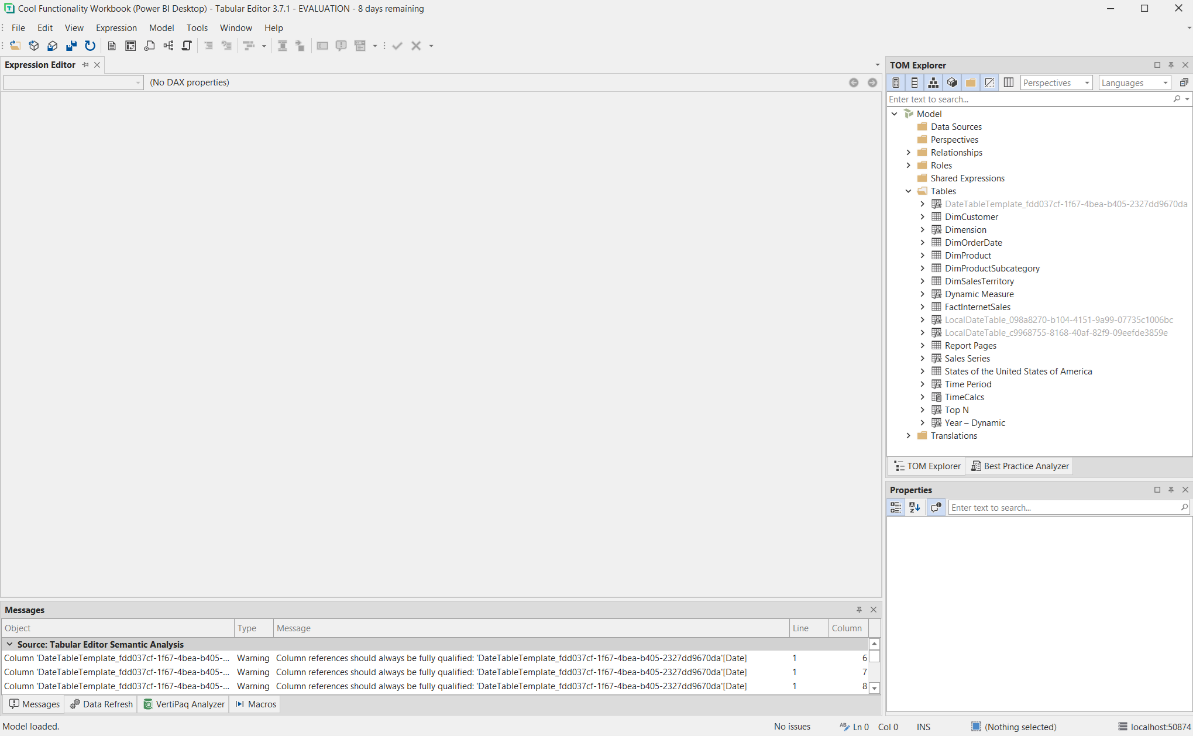
Here we see our dataset opened in TE3:
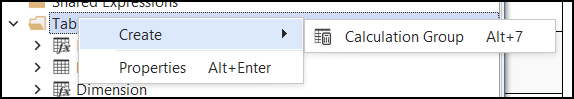
Start by right clicking Tables, then selecting Create → Calculation Group.
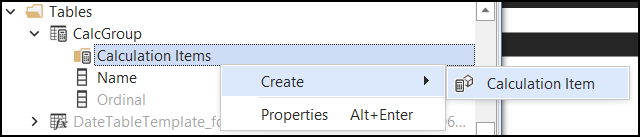
After naming your new table, right click Calculation Items and select Create > Calculation Item.
Here’s where you will define your different variations and calculations. For this example, we’re going to create four versions of sales.
Start by creating four calculation items named Current, MTD, QTD and YTD. For each of these, define the correct DAX expression.
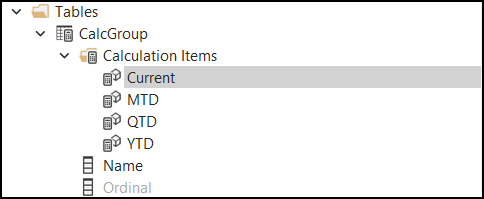
Click on Current. On the left of the screen, enter in the following DAX: SELECTEDMEASURE(). This will return the value of the measure we drop on the matrix in our report.
For the remaining iterations use the DAX below substituting your date table:
MTD – CALCULATE(SELECTEDMEASURE(), DATESMTD( DimOrderDate[OrderDate]))
QTD – CALCULATE(SELECTEDMEASURE(), DATESQTD(DimOrderDate[OrderDate]))
YTD – CALCULATE(SELECTEDMEASURE(), DATESYTD( DimOrderDate[OrderDate]))
Now that your group is defined, save the query and return to Power BI.
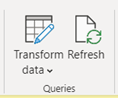
After in Power BI, click Refresh to refresh the dataset.
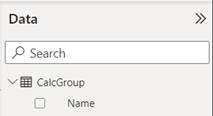
Your new table in the dataset now appears:
Start a new report page and add a matrix visual. Leave room on the page to add a slicer later.
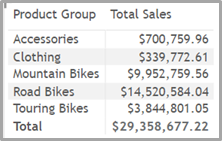
To the matrix add a dimension of your choice to the rows. On the value we will add our “selected measure.” This will be the measure used by our group to calculate the iterations. For this example, we used Product Group as the dimension and Total Sales as the selected measure:
Now it’s time to add our group. From the created table, drag Name to the columns.
We get all our results:
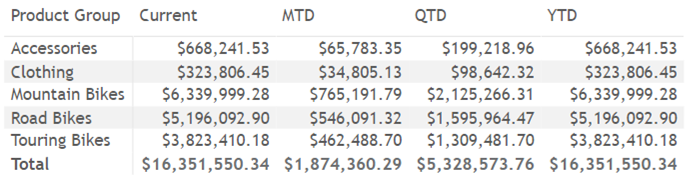
As you can see, we’ve used one field to create four columns! Neat!
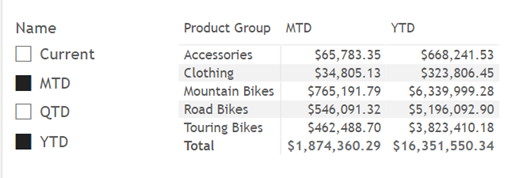
Next, let’s add a slicer to allow users to choose which columns they want to see at any given time:
You can also create groups to allow users to choose between different measures as well. For example, you could create a calculation group consisting of sales, profit, total product cost and COGs. This could also be put on a slicer, resulting in a truly dynamic report!
Object-level security
Securing row-level data in Power BI is a straightforward process that has been in the product for quite a while. However, what about securing data at the object level?
Using Tabular Editor, we can specify security at the object level. As with calculation groups, Tabular Editor must be installed and working. Security can be configured in either version of Tabular Editor.
The first step is to create the roles that will be used to define security. In Power BI go to the Modeling ribbon, then click on Manage roles.
Click Create and add the name of the new role you wish to use. You do not need to specify more than the name here in Power BI. For our example, we created a role called Sales.
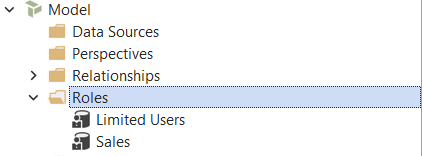
Next, launch Tabular Editor from External tools. Under the Model view > Roles, you will see the new Sales role we created:
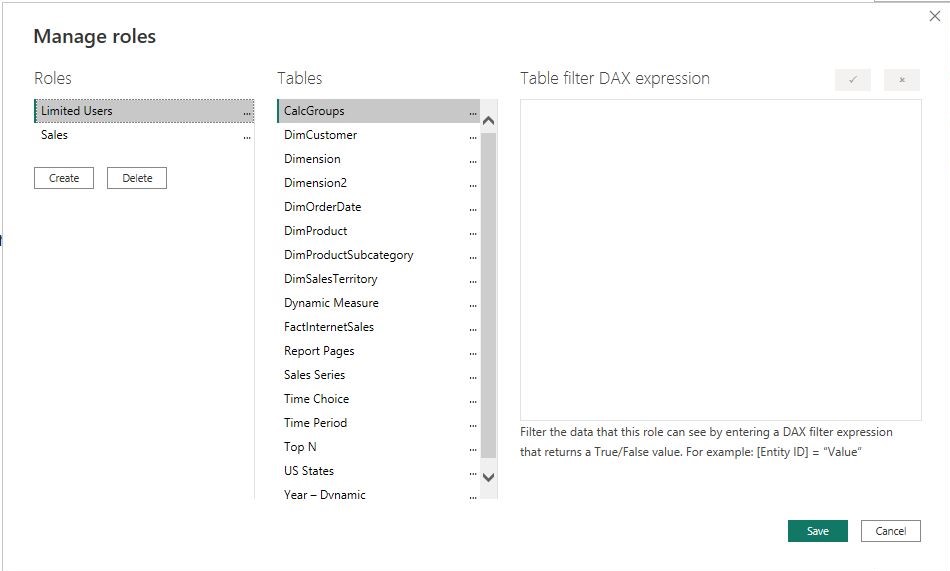
Select the role. Under Properties, find the option for Table Permissions. Expand this out and you will see a full list of the tables in our model.
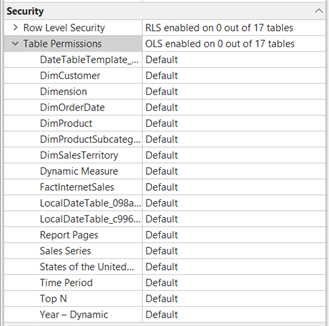
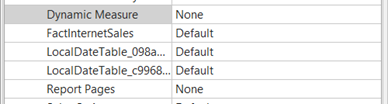
For each of the tables we wish to secure, we can click on the table and change it from Default to None or Read. Here we’ve chosen to set two tables, Dynamic Measure and Report Pages, to None.
Save and refresh the dataset in Power BI.
To test this out, click on the Modeling ribbon and click View as roles. Here we can preview how this dataset will look for users in a role.
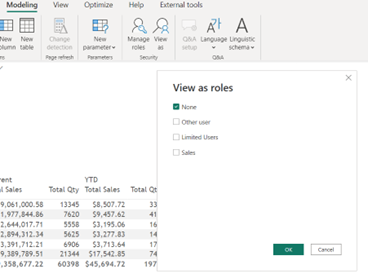
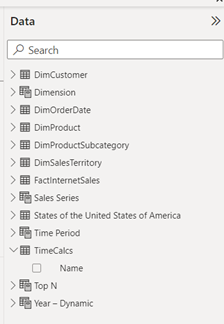
Check the box next to Sales and click OK. Now when we look in our Data pane, we no longer see the two tables.
Summary
Using an external tool like Tabular Editor can grant a Power BI developer access to a deeper and more robust way of modeling. Whether you choose to use the free TE2 version or the licensed TE3, adding Tabular Editor to your toolbox will open up a world of possibilities!
Feature overview: TE2 and TE3
This table* shows all the main features of both editions of the Tabular Editor tool.
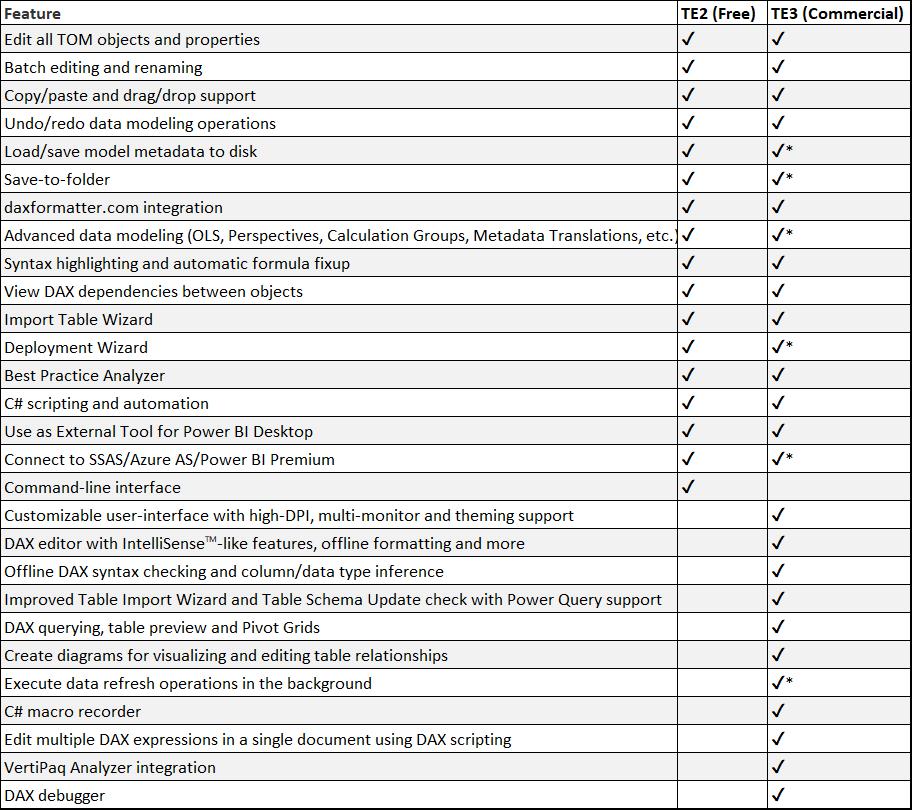
* Table courtesy of Tabular Editor.