Upgrades, migrations and audits are just a few reasons why you will periodically need to test and validate every single report being used in your organization. It is during these times that you often realize the enormity of the volume of reports that exist (many of which look identical) and wonder if there are opportunities to consolidate. And when you are working with Cognos Analytics, the answer is almost always YES!
There are various reasons why you may have several reports that are very similar. Below is a list of the top three.
- Date filter requirements (monthly, MTD, YTD, and rolling 12 month)
- Layout requirements by output type (HTML, PDF, Excel)
- Top-ranked and bottom-ranked filtering requirements (top 2 regions by sales, bottom 3 products by profit)
In this blog, we give you step-by-step instructions for consolidating date filter requirements reports. For instructions on consolidating layout and top-rank/bottom-ranked requirements reports, download our whitepaper.

Data filter requirements
One of the huge benefits of sourcing Cognos Analytics reports from cubes is often the ability to quickly modify the date context. A report author can quickly switch from showing month-to-date, quarter-to-date, year-to-date, rolling eight quarters or an endless number of other date range options as those are typically defined in the cube and accessible via drag and drop. Unfortunately, a cube is not always available or practical for many business cases.
Relational data sources typically require the report author to create date range variations by using detail filters, which often results in multiple instances of the exact same report with the only difference being the date filters. Let’s look at one example and find a creative solution that will accommodate several user selected date range options in a single Cognos report.
Business requirement
Create a visualization that shows monthly revenue or gross profit with the ability to select a MTD, YTD or rolling 12 month time frame.
We want to give the end user the ability to select the time frame as well as the metric to evaluate performance.
Solution
- Create a Column Chart using the GO Sales (query) sample package.
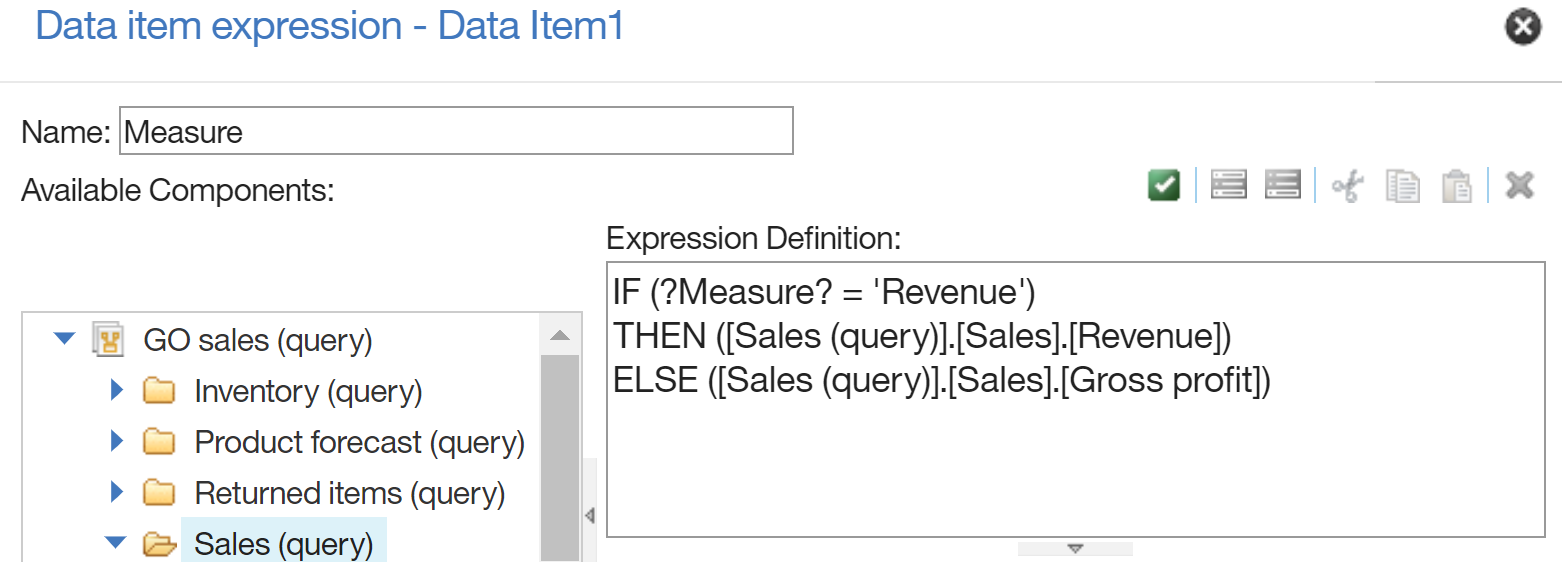
- Drag a Query calculation from the Toolbox into the Default Measure drop zone with the following expression:

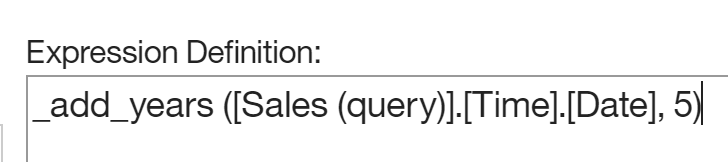
- Since our sample data is aged we will simulate a current data set by adding five years to the data set. Navigate to the query and add the following query calculation named Date to the Data pane:

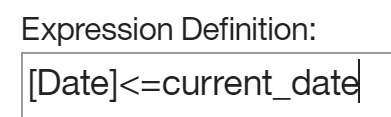
- Eliminate future data by adding the following detail filter:

- Select the Data tool, expand GO Sales (query) > Sales (query) > Time and drag Month number into the data pane.
- Navigate back to the report page.
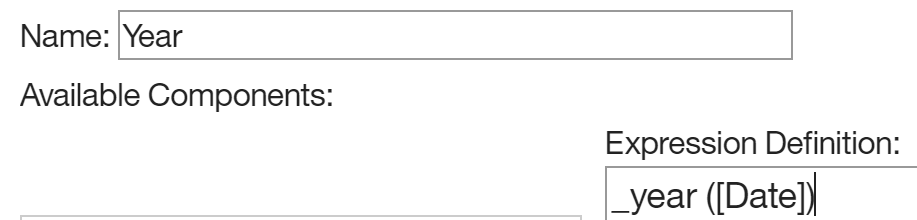
- Drag a query calculation from toolbox into the column chart Series drop zone with the following expression:

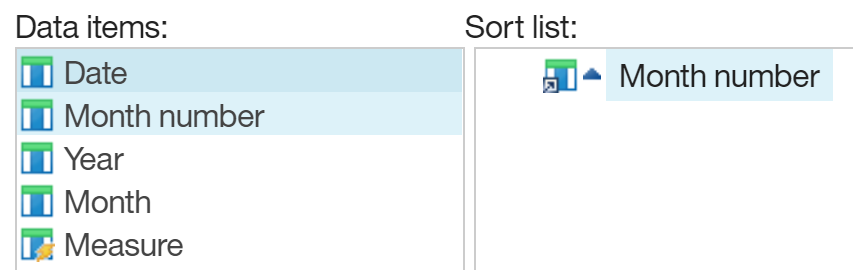
- Select the Data tool and nest GO Sales (query) > Sales (query) Time > Month below Year.
- Select the Month chart node member and Edit Layout Sorting using the on-demand toolbar.
- Sort by Month number:

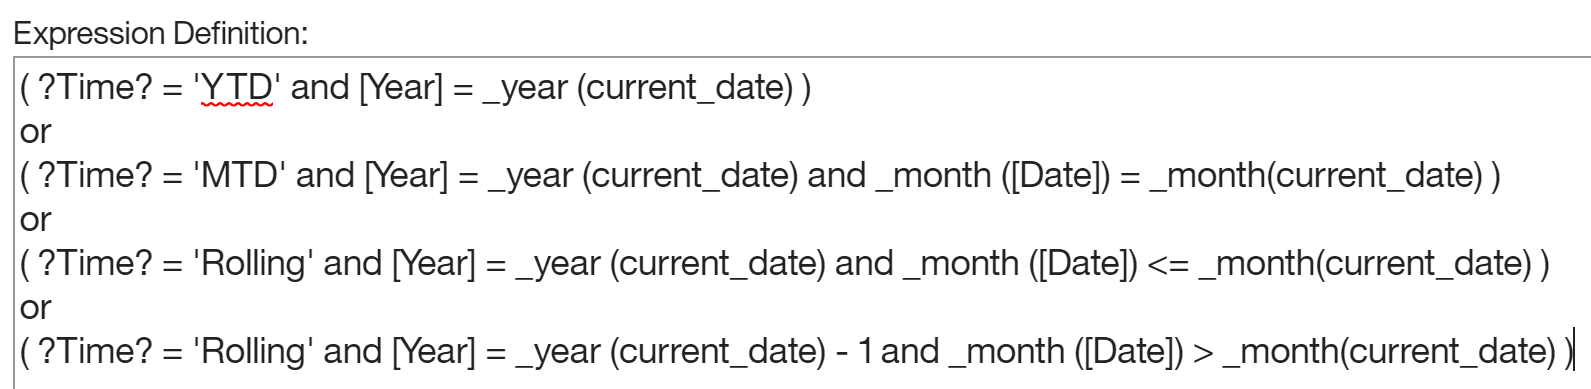
- Create the following filter to accommodate our three-date range options:

- Drag a Table from the Toolbox into the work area in the front of the chart.
- Keep the default 2 columns by 1 row selections and deselect the Maximize width.
- Drag a Value prompt into the left cell of the table.
- Choose Use existing parameter and select Time. Click Finish.
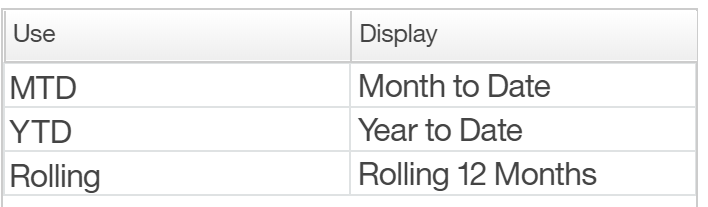
- Add the following Static choices to populate the value prompt from the Properties pane:

- Set the Default selections property to MTD.
- Set the Auto-submit property to Yes.
- Drag a Value prompt into the left cell of the table.
- Choose Use existing parameter and select Measure. Click Finish.
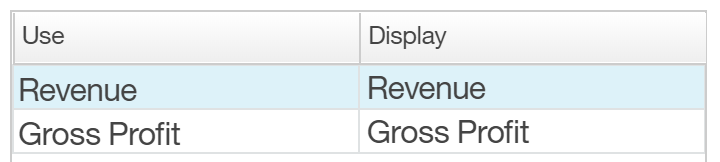
- Add the following Static choices to populate the value prompt from the Properties pane:

- Set the Default selections property to Revenue.
- Set the Auto-submit property to Yes.
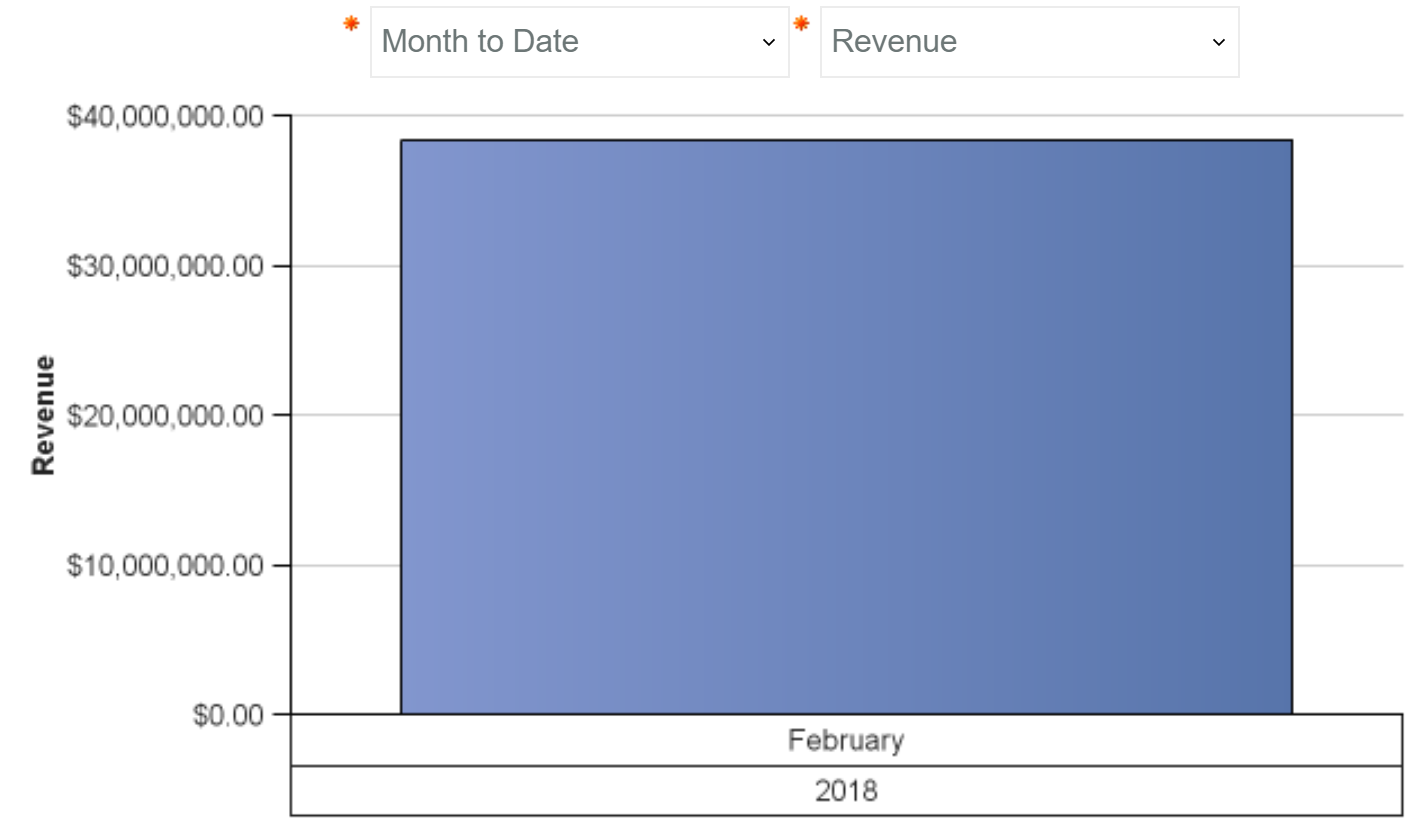
- Run the report and test the filters.
MTD monthly revenue
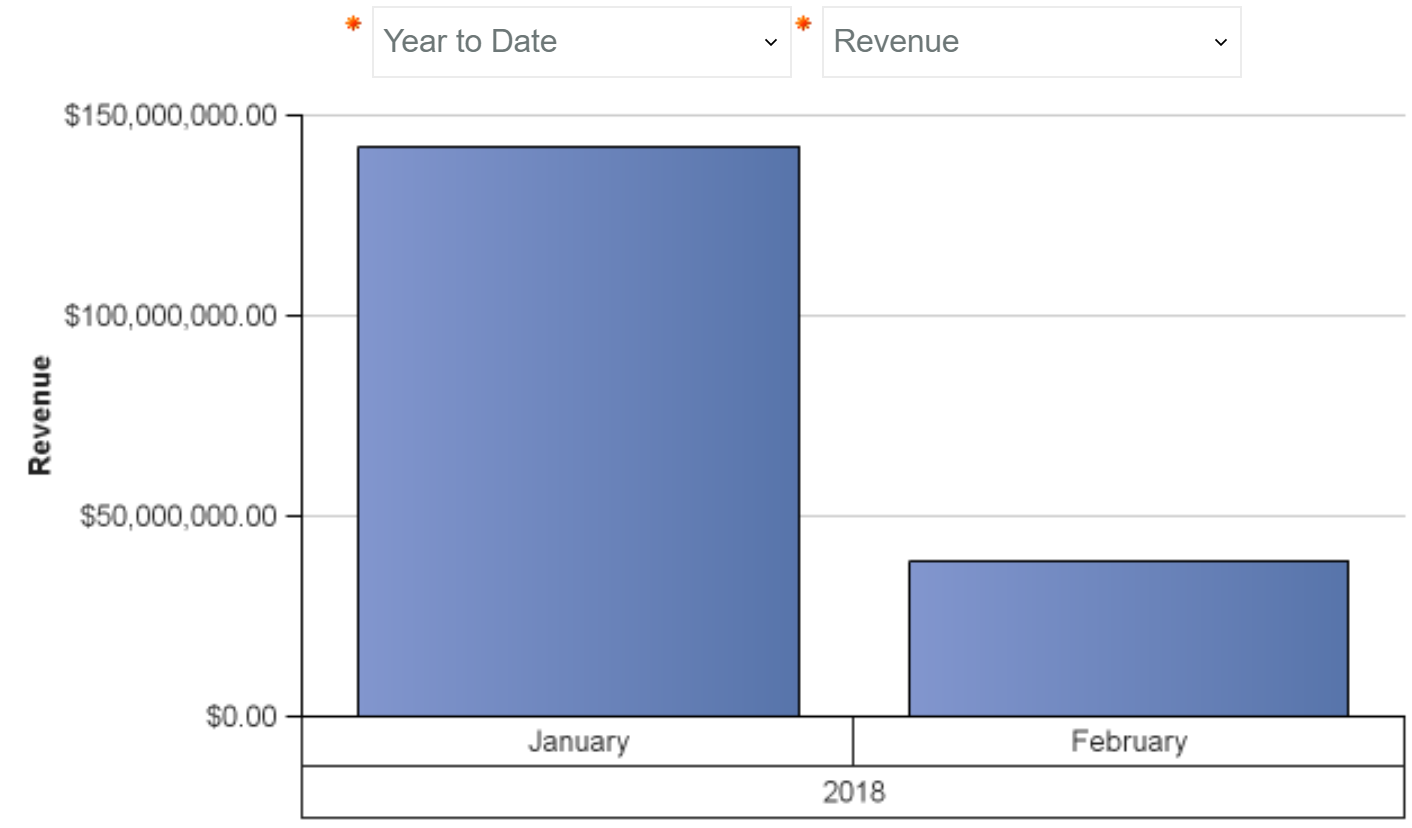
YTD monthly revenue
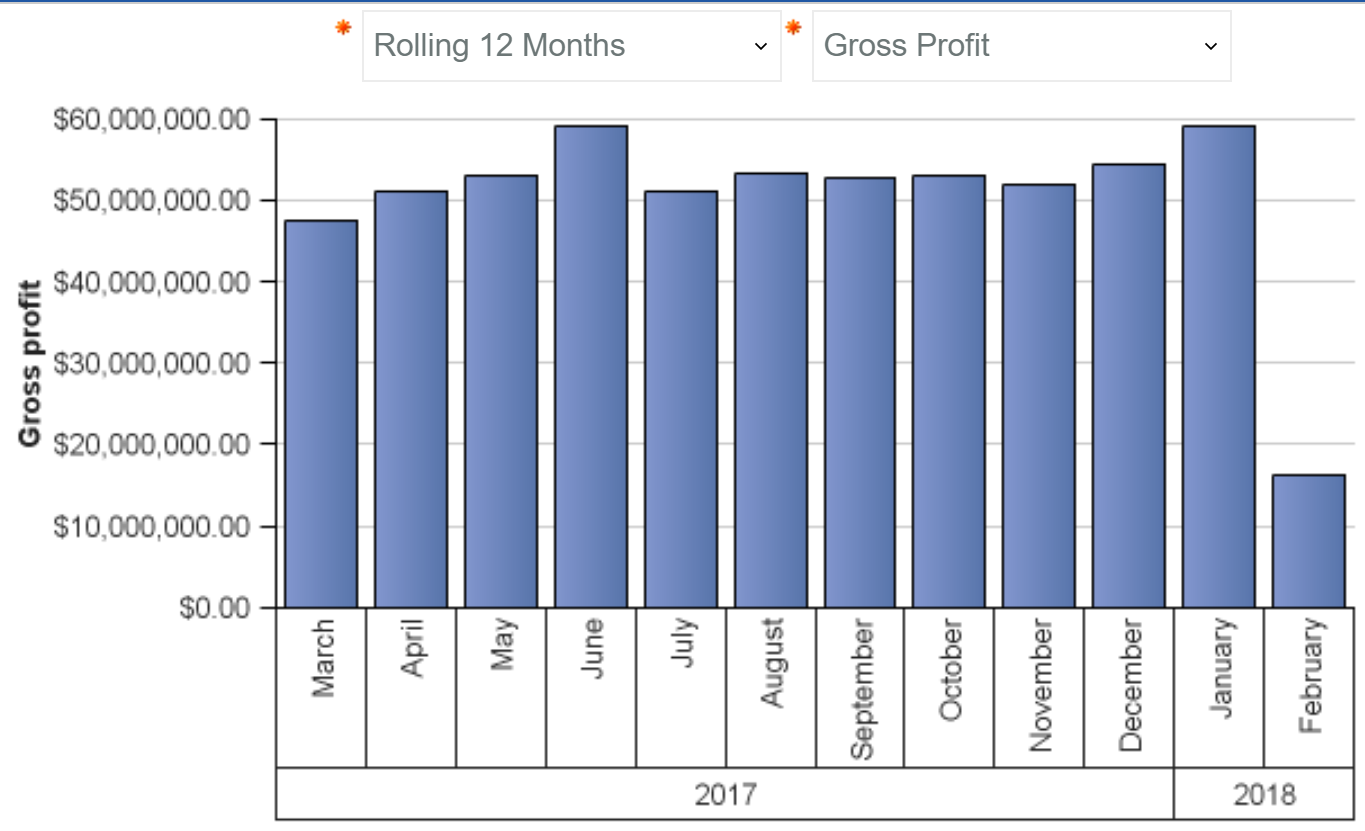
Rolling 12 months monthly gross profit
In summary
Our design accommodates six report variations (3 date ranges x 2 measures) in a single report.
Next steps
Use the steps described above for consolidating date filter requirements reports. For instructions on consolidating layout and top-rank/bottom ranked requirements reports, download our whitepaper.