How does the existence of Copilot affect those of us who work in analytics? Is this presence of AI capabilities an attempt to replace what we do? Or, rather, does Copilot let us get meaningful data and results faster, easier and more consistently?
Copilot brings the speed and efficiency of AI to the mechanics of doing BI. It can open doors that were previously only available to analysts with years of experience. Copilot can help inexperienced users write code or see data from a new perspective, helping them to rapidly explore data with the finesse of a more experienced user.
In this blog, we will show you examples of using Copilot to expedite creating a measure, build an advanced visualization and create an entire narrative.
This is the first of three blogs on AI in analytics reporting. Read our blog about Cognos Analytics with Watson. Watch for our upcoming third blog, AI in Tableau.
Copilot in Microsoft Power BI and Fabric
Over the years, Microsoft Power BI has established itself as a true leader in analytics. With Fabric, functionality gets stronger with each release. The introduction of Copilot AI truly upped the analytics game.
Copilot was first introduced as “generative AI” that helped to create reports automatically. From that simple beginning it has evolved in strength and capability. With Copilot, new users can understand DAX. Or users can ask Power BI in natural language to create a measure on the fly.
Let’s look at some examples. NOTE: to do some of these examples you’ll need to have the right options enabled in Preview features.

Time period comparisons. Let’s say we want to look at annual sales for some time period, like a one year compared to the prior year. We could go through the process of creating a new measure OR we could use Copilot to help expedite the process.
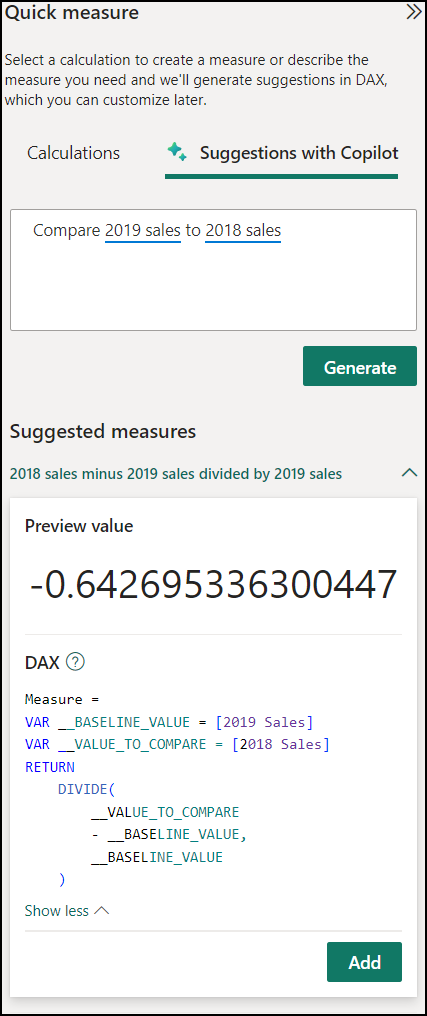
Clicking on Quick measure provides the option of using natural language to ask Copilot to help us create a measure.
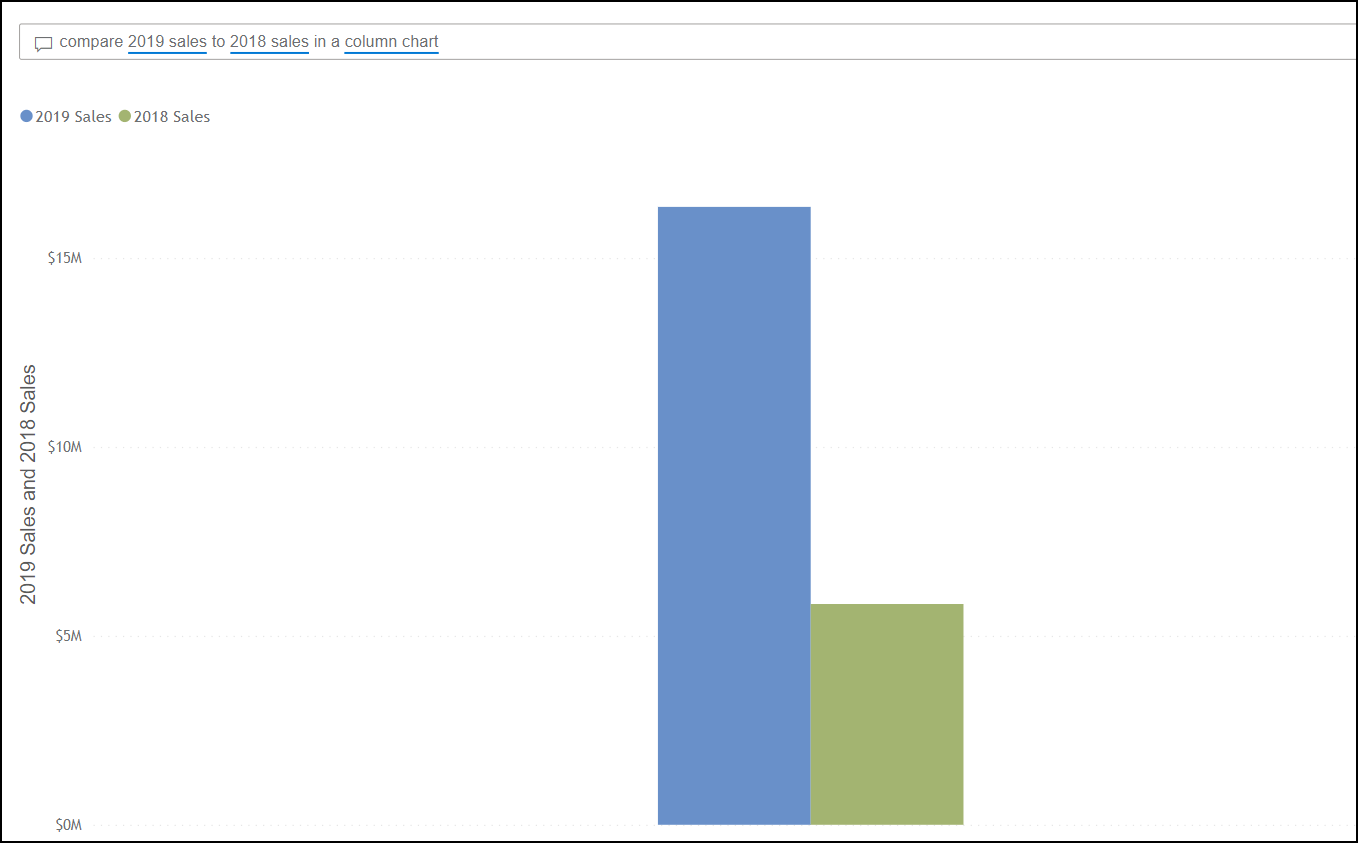
Asking Copilot “compare 2019 sales to 2018 sales” it returns the following:
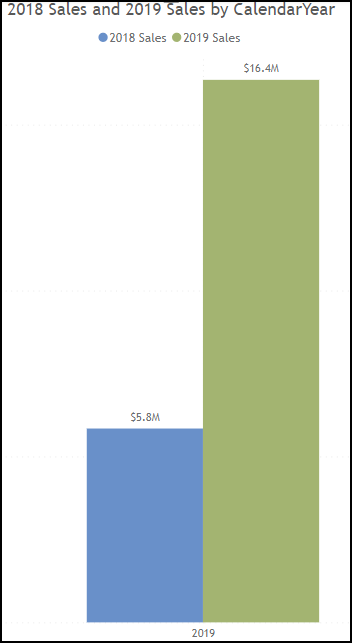
If we create a visualization of the fields, we see that in fact our 2018 sales were approximately 64% lower than 2019:
Copilot not only gave us back correct information but look at the DAX it automatically generated! This functionality provides us with both information and a learning experience. We can now save this measure to our dataset and reuse it in future visualizations.
Q&A visualizations. We can use Copilot inside of Power BI Desktop to generate more advanced Q&A visualizations.
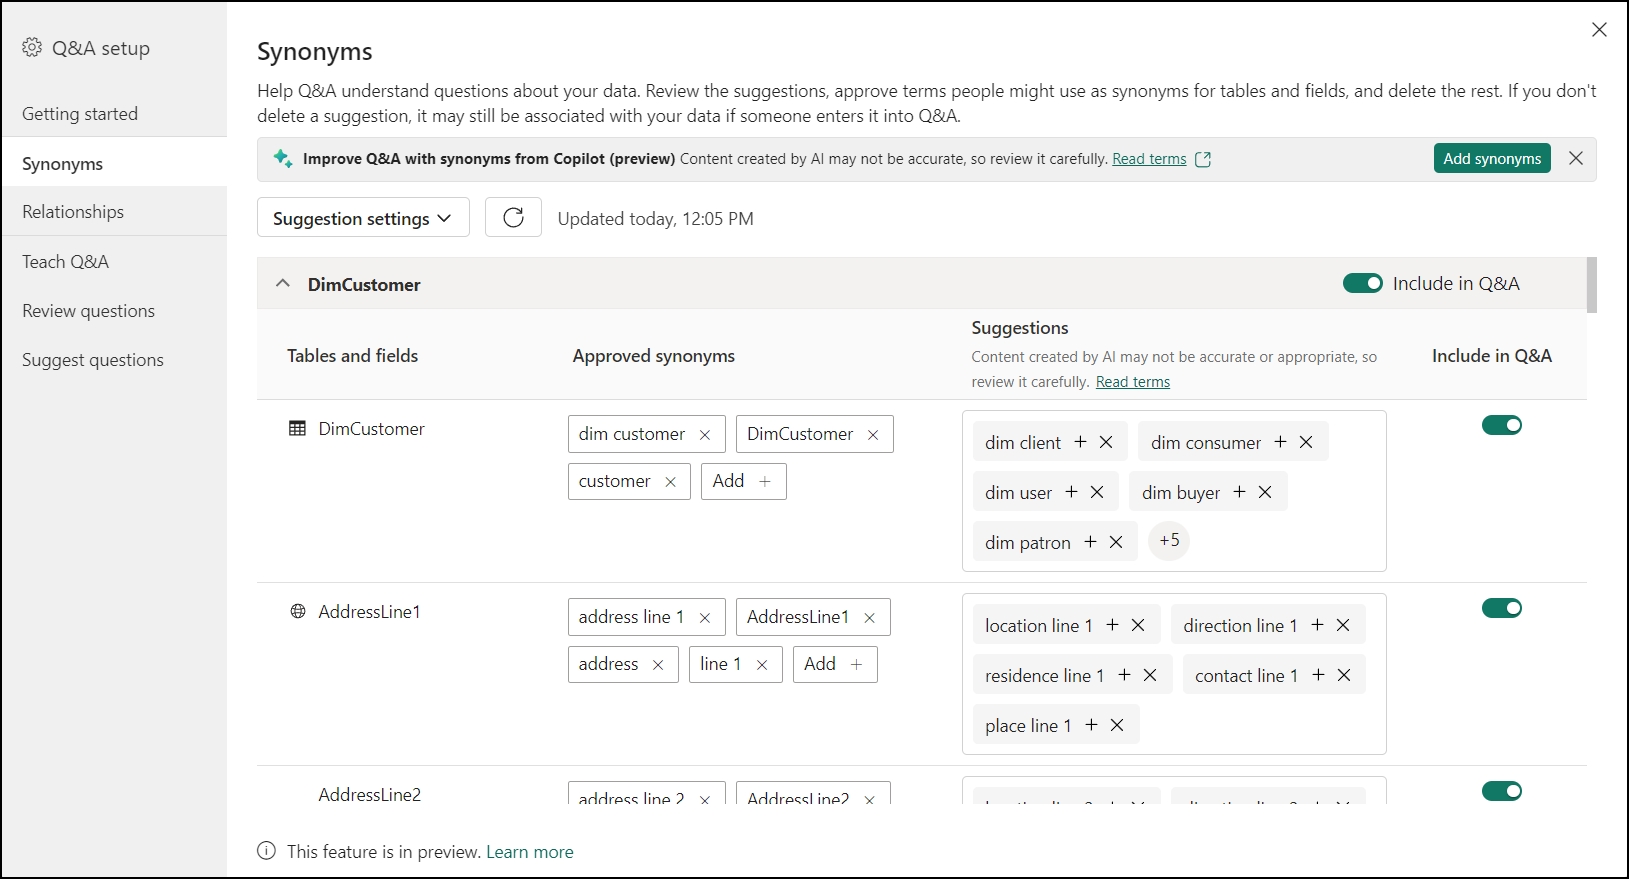
First, we create synonyms to help Copilot understand what fields we’re looking for or referencing when we ask questions. Manually adding synonyms can be a time-consuming process, but once again Copilot makes it easier.
When we first put a Q&A visualization on a page, if there are no synonyms in the model, we get this:
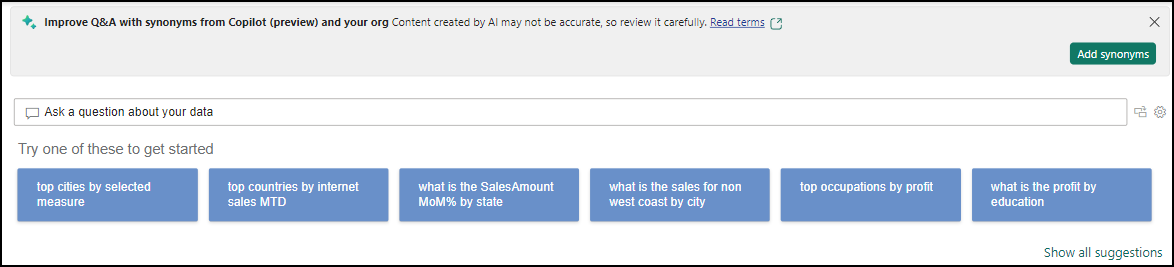
Copilot provides suggestions to start with that you can use to automatically generate needed synonyms! With synonyms added, Copilot is now ready to help build visualizations.
In the setup for a Q&A visualization we can accept, edit or remove any synonyms that don’t make sense:
Using the same example above, let’s see how Copilot does. When we ask the Q&A visualization the same question and ask to see the results in a column chart, we get this:
Nifty! It’s almost identical to our manually created report above.
But what about full report pages? Can Copilot help us with that? You bet it can.
Use Copilot to build reports. When we move into the Fabric/Power BI service part of Copilot, we can leverage it to create entire reports from scratch or provide a narrative summary.
NOTE: Prerequisites to using Copilot on the service. Most important, you need a Premium workspace with an F64 capacity. The latest information from Microsoft on what’s needed to use the service can be found here.
With our environment set up, we can now use Copilot to build reports and provide narrative data. Let’s start by looking at how to build a report.
First, we select our dataset from our workspace. Then select Create a report.
Once in the report builder environment, the option to use Copilot appears at the top:
Click the Copilot button to open the Copilot pane:
We can then ask Copilot to help us uncover insights in our data by suggesting content for our report.
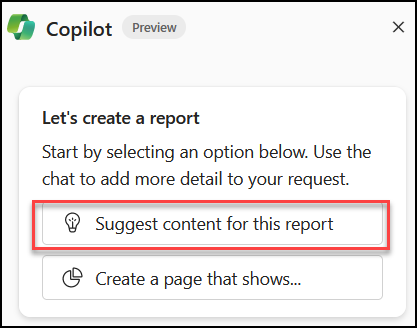
Copilot will examine our dataset and return options:
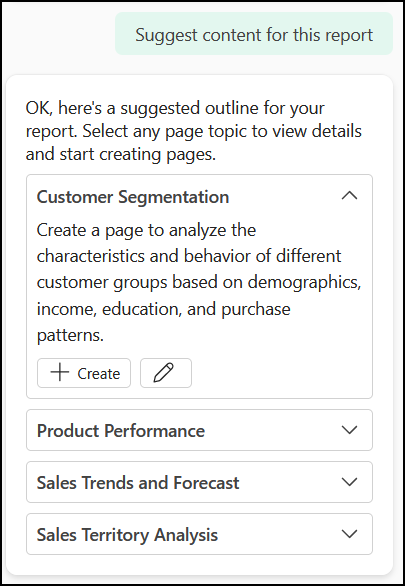
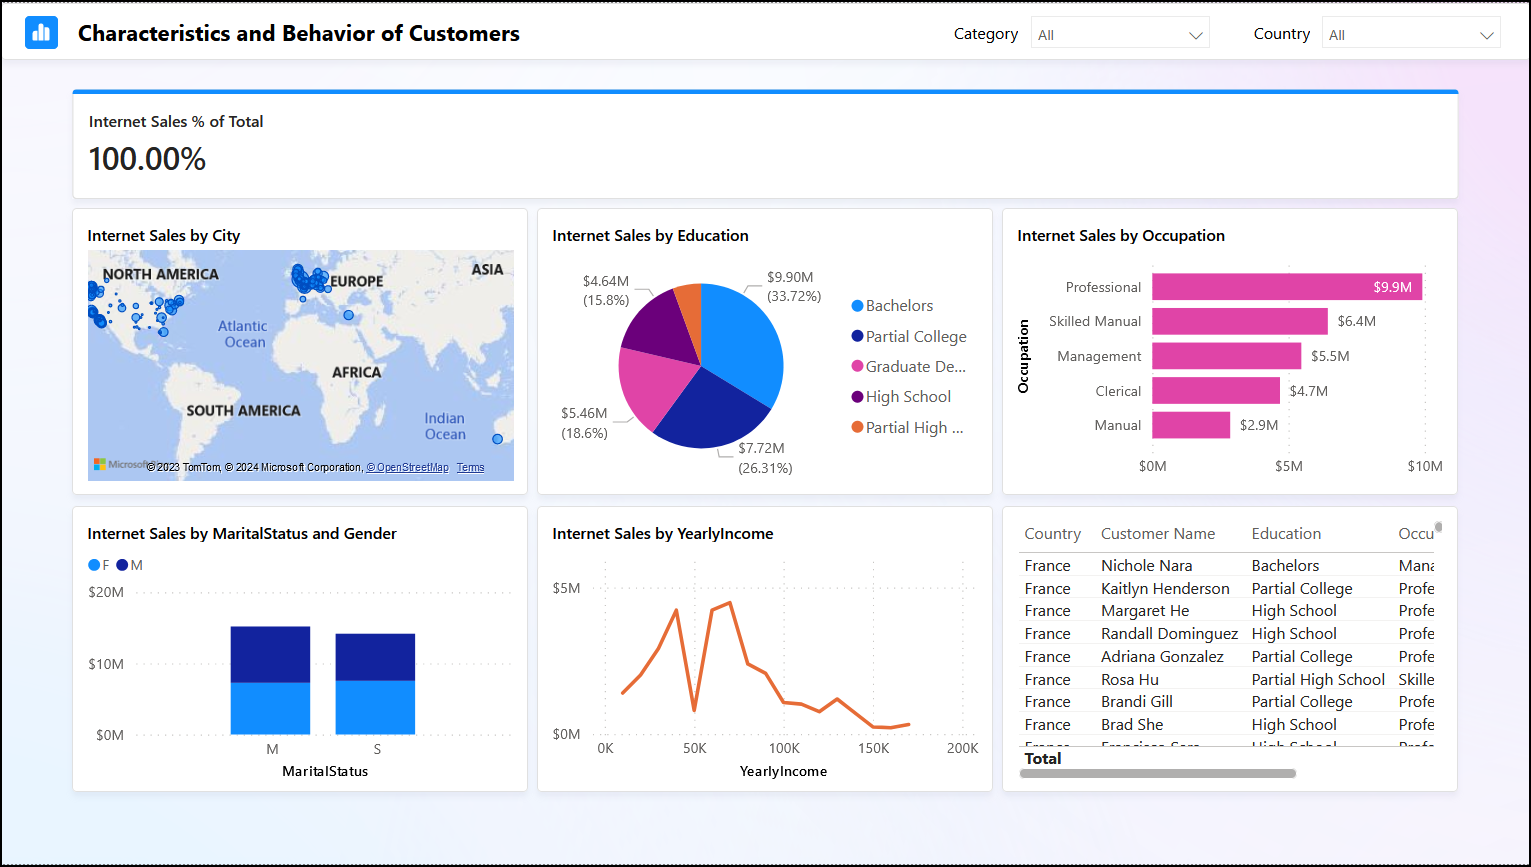
Let’s try the first option Copilot suggests, Customer Segmentation. With just one click and about 30 seconds of wait time, Copilot produces a full report:
We can now save this report and share it with others in the organization, just like with any other report in the Power BI service.
Use Copilot to create a narrative. We can use Copilot to create a narrative. The Copilot Narrative icon is the same as it has been in previous releases but now provides additional options.

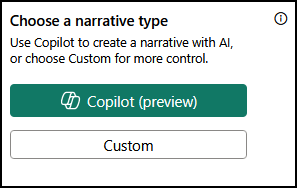
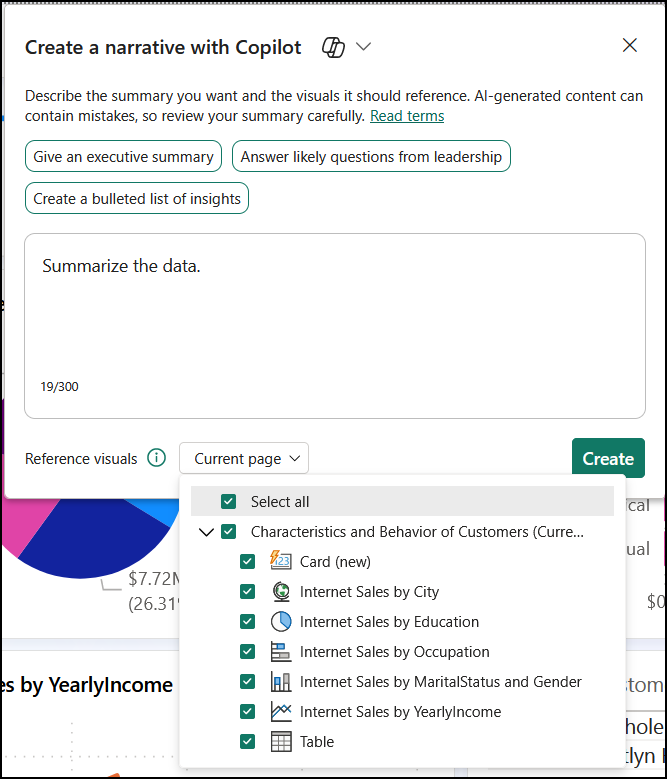
From the dialog box (below) we can specify how we want the Narrative to look. We can choose from a basic summary to an executive summary and can select the detail levels. Copilot lets us tell it explicitly which pages and visualizations to include in the summary.
Let’s do a basic summarization to see what Copilot returns.
The resulting Narrative provides insights into our data. These insights can be left on the main report page or copied to another page in the workbook to make reading and digesting easier. This information can also be shared via Teams if desired.
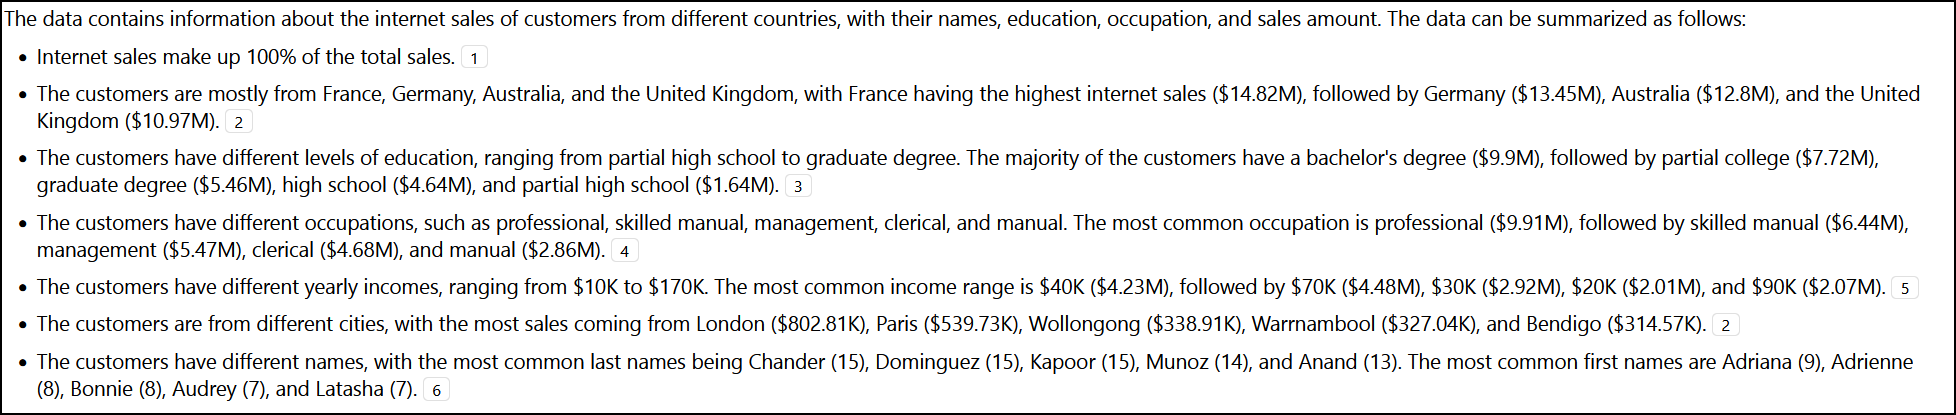
Each of the points in the Narrative refers to the specific visualization where Copilot sourced its data.
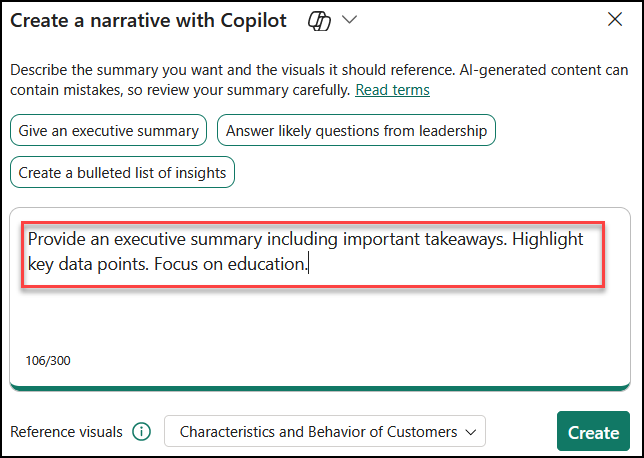
From here we can create custom prompts to get more nuanced or specific details on our Narrative. As we saw in Power BI desktop, users can express their questions in natural language to get to the details.
Let’s ask the Narrative for a more specific view of our data:
Copilot takes our prompt and produces a new Narrative:
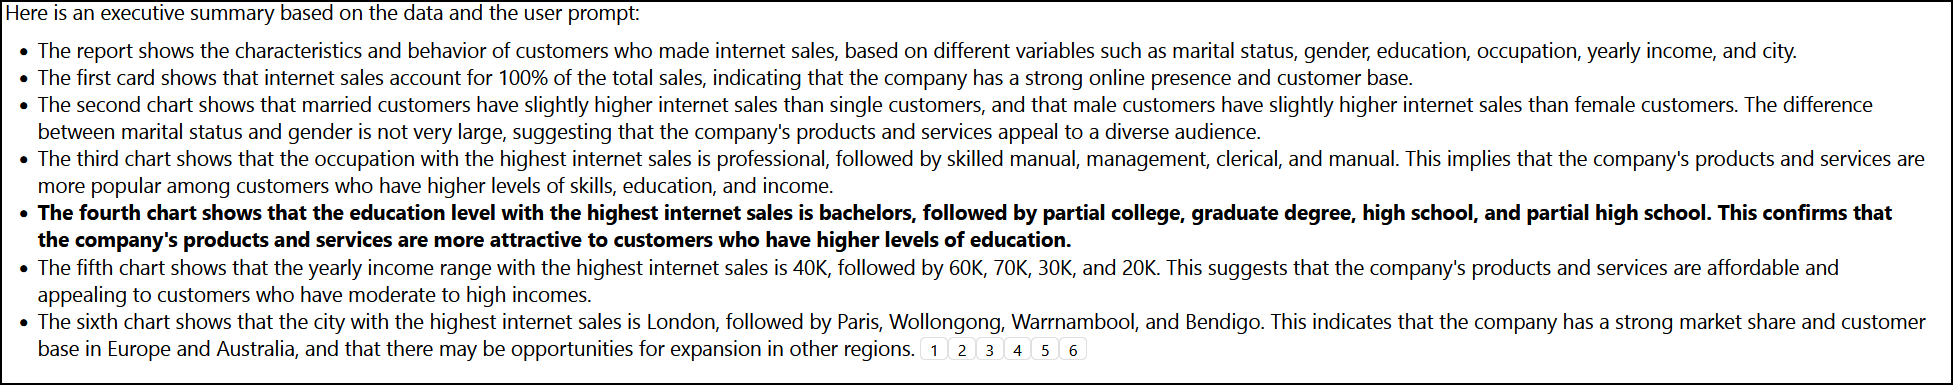
With this exercise you can see that Copilot has done more than merely help to build a report page. It helped us to understand what elements are important on the page and with our business!
Bottom line on Copilot
Copilot changes how we approach analyzing and reporting on data and ultimately makes us better at our jobs. Copilot can quickly generate complete reports from our data. It levels the playing field, making it easy to perform advanced calculations and programming. Copilot helps uncover insights faster and more efficiently. We will spend less time on the mechanics of working with data, and gain more–and better–time to reflect on insights and take action.
Are the insights Copilot provides always the best and 100% accurate? No. With Copilot, that has to with the opaqueness of its inner working as well as the quality of the source data feeding it. AI requires accurate data to achieve the best results. Read our blog Are Copilot’s Calculations Correct? for important caveats.
Data quality and AI. Using quality data remains the backbone of facilitating accurate, performant BI. AI works in service to BI, so it makes sense that even with all its amazing functionality, AI can’t do its job well against poorly structured data sources.
Senturus can ensure your data is AI-ready. Creating well-structured data is one of our core strengths. Whether you’re moving to a new tool or just looking to work more efficiently with what you already have, we have the expertise to guide you on this journey.
| Contact us and let’s talk about your plans for modernizing or how you need better results from your existing analytics environment. We’ll ensure your insights don’t result in things like this: |  |