A long-standing platform with a rich history of analytics capabilities, Cognos is no stranger to helping people uncover data insights. Over the years, Cognos has been focusing the platform to support more self-service, moving functionality out of the hands of IT staff and into the hands of analysts. When Cognos integrated IBM Watson for its AI tool, they made clear their support for this direction.
In this blog, we will show examples of how Cognos with Watson brings more power to explorations and natural language queries in the Assistant.
This is the second of three blogs on AI in analytics reporting. Read our blog about Microsoft Copilot. Watch for our upcoming third blog, AI in Tableau.
Cognos Analytics with Watson
Watson made an early splash on the AI scene back in 2011. It was introduced on the quiz show Jeopardy, where it competed against championship contests to answer questions, and won. Having been re-imagined for different business uses cases since, it serves as a powerful tool for analytics. In the Cognos v12 release, the integration of Watson is tighter and more intuitive, making data exploration and analysis more accessible for all users.
Using explorations. Although explorations have been around for a while, the V12 puts emphasis on this fantastic tool. It offers a number of methods for delivering insights into data.
When we start a new exploration with a package or model, we get the following:
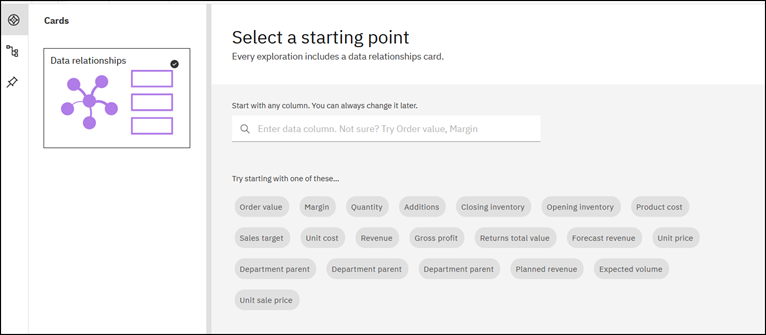
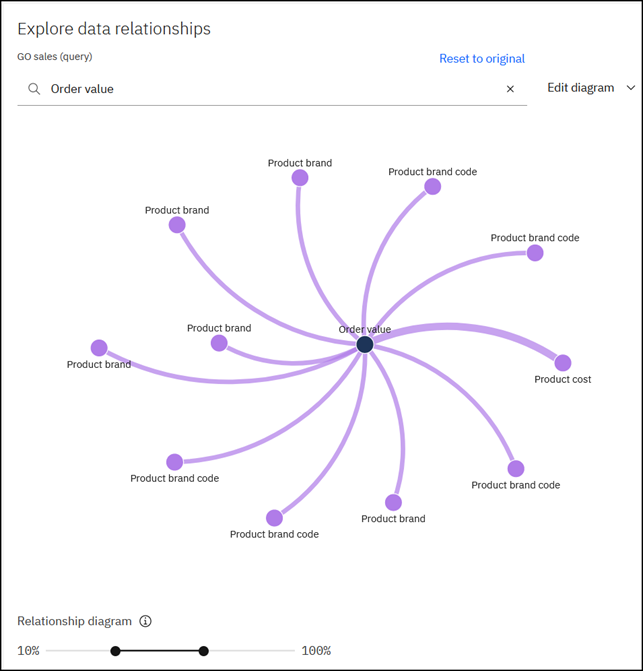
From here we can choose which columns we want to include, or we can skip and let Cognos examine our data. When we skip, Cognos looks at the data and tries to find relationships. The resulting information lets us see what has the most relevance in our data set and how it is impacted by other fields.
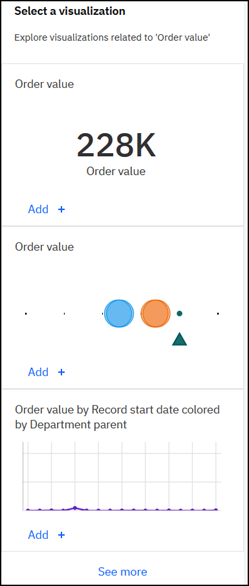
We get a set of pre-built visualizations based on the relationships:
A nice feature in Explorations is the ability to see statistical information about our data using predictive strength drivers and correlations. By selecting one of the starting visualizations, insights into the data becomes available.
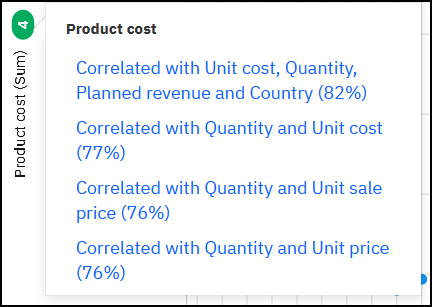
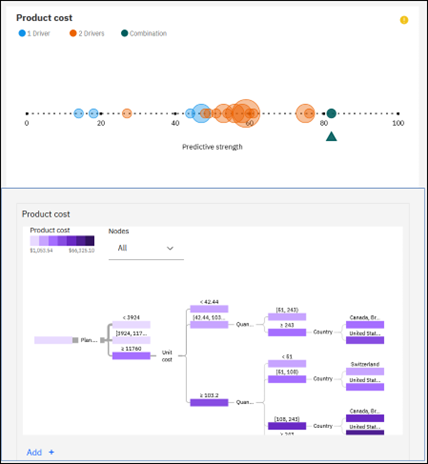
Drilling down further we get the predictive strength and key drivers that feed our correlation.
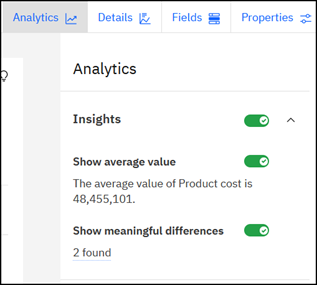
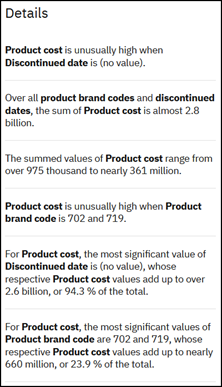
For more details we can enable the Analytics option and the Details option:
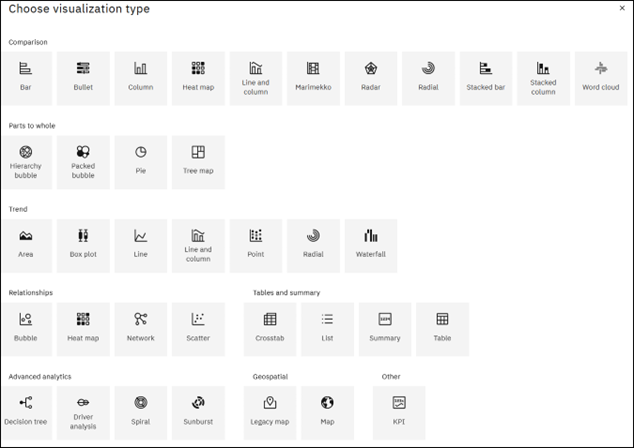
If there is a particular piece of data we wish to work with, we can use Explorations to build out the visualizations. We can choose from a large selection of visualization types.
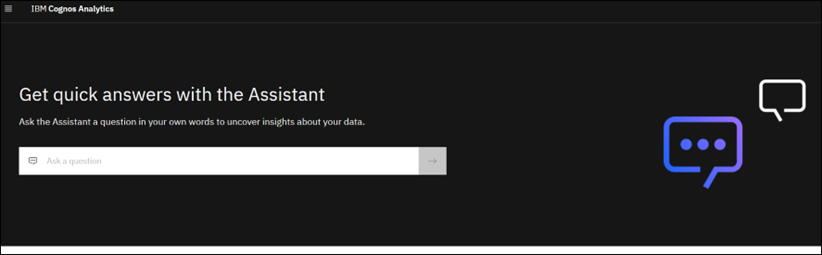
While all of these AI-driven analytics are great, the big strength comes in the form of the Assistant. As with Microsoft Copilot, Cognos allows users to use natural language queries to create visualizations and more.
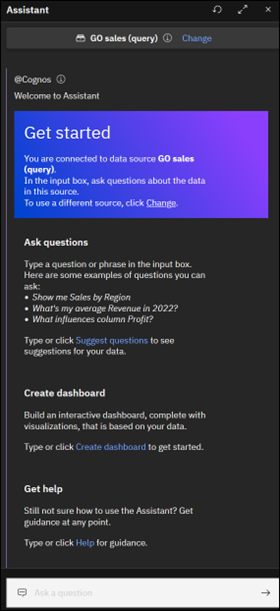
When we start the Assistant, the first thing it asks us is if we want to continue using the current data source or change to a new one:
NOTE: To use a Cognos package in Explorations, it does need to be enriched. For more on enriching packages, see IBM’s documentation (this process is the same in V11 and V12).
Let’s ask Cognos a question about our data and see the results. We will change to a data source that works.
For the following example, we’re using a data source containing sales information about coffee sales. We can ask the Cognos Assistant to help us out with questions.
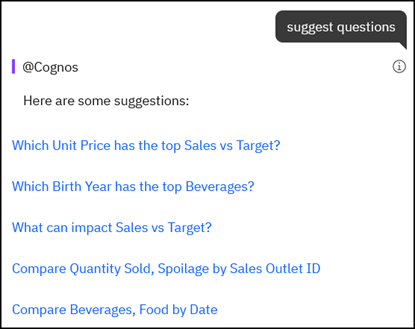
Let’s ask it to “suggest questions.”
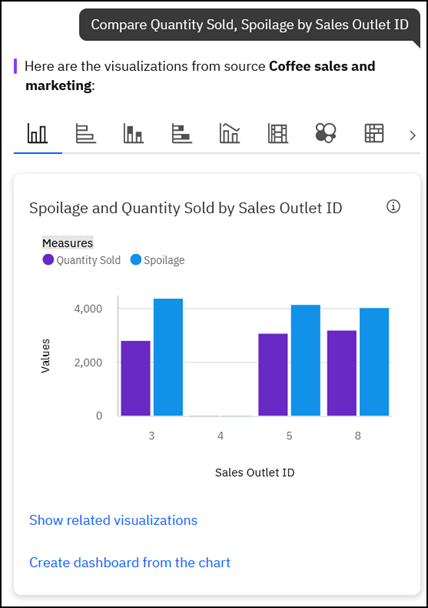
Below, we see what is returned when we select the question about Spoilage. We can click on this visualization to do a deeper dive, see correlated information, or perform comparisons of our data points, perhaps by Sales Outlet.
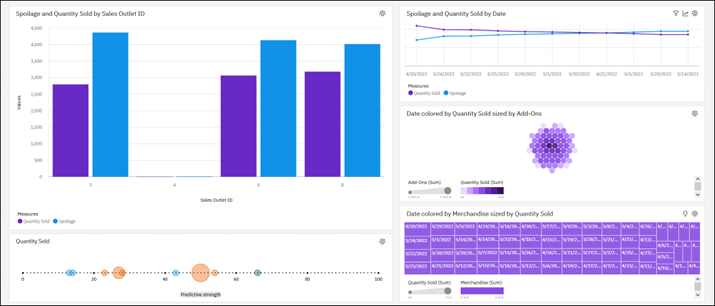
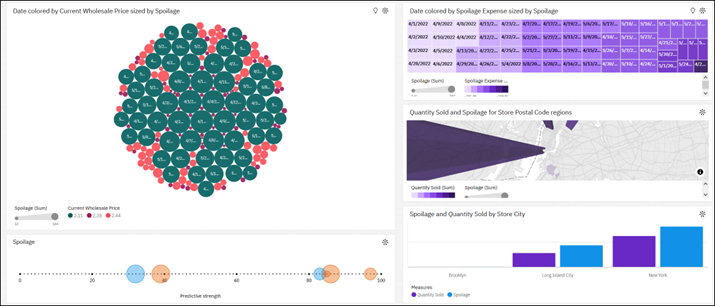
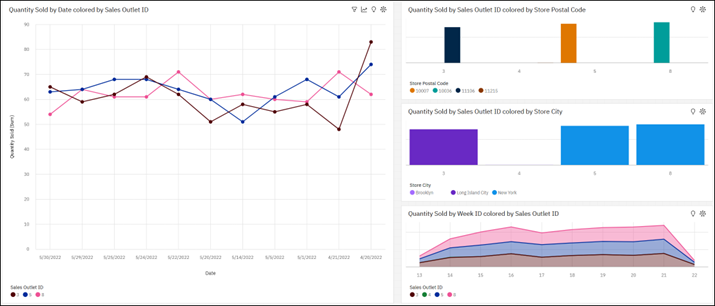
Look at the bottom of that dialog box. Note the option to Create dashboard from the chart. This capability is one of the most interesting and powerful in Explorations.
With one click, Cognos will produce a full dashboard ready to be saved and distributed! The dashboard includes an overview page plus detailed pages for each Sales Outlet and Spoilage data. Again, all of this was generated by asking one question and clicking a single button.
A note for v11 users. Remember, AI functionality in Cognos has been available in Explorations for a while. If you’re currently on V11 and not quite ready to upgrade, that’s okay. You can still take advantage of this functionality in your current environment. The biggest enhancement in V12 is the ability to access the Assistant from any report or dashboard (or even the home screen!).
More than elementary, Watson
AI implementation in IBM Cognos is sophisticated and powerful. It including AI capabiliites found in other analytics platforms, including natural language understanding and the ability to offer data insights. But with its statistics and accessibility, Watson stands out. These statistical functions allow for analysis driven results; by using known statistical functions like quartile or k-means clustering you can be confident your results are mathematically sound for your business. With the Assistant available from the home page, you can get insights no matter how you use the Cognos interface.
Data quality in AI
Watson in Cognos is a great example of how AI in BI applications works to make it easier to access insights and perform advanced tasks. But, as with all AI, it is not infallible. Insights may not always be 100% accurate or of the highest quality. The reason: source data quality.
Quality data is still the backbone of accurate, performant BI. Even with its amazing functionality, it can only produce results that are as good as the data informing it. Like a human analyst, AI requires correct, well-structured data to achieve the best results.
Senturus can ensure your data is AI-ready. Creating well-structured data is one of our core strengths. Whether you’re moving to a new tool in 2024 or looking to optimize what you already have, we can expertly guide you on this journey.
Contact us and let’s talk about your plans for modernizing or how you need better results from your existing analytics environment.