- Blog
Creating a Big Numbers KPI Dashboard in Tableau
Learn our method for building a big numbers sales and profit KPI dashboard in Tableau.

Learn our method for building a big numbers sales and profit KPI dashboard in Tableau.
We tell you about the features, pricing and admin functionality.

Steps to create, publish and set up email subscriptions for paginated reports.

Most companies use more than one BI tool, we examine bimodal analytics so tools run optimally.

We took Ask Data for an extensive test drive and answer lots of questions.

Get a better understanding of Power BI licensing.

Learn how to overcome printing report challenges with Power BI.

A simple exercise showing the types of Salesforce reporting you can do with Power BI.

Power BI resolves many of the pixel perfect, burstable and paginated report issues.
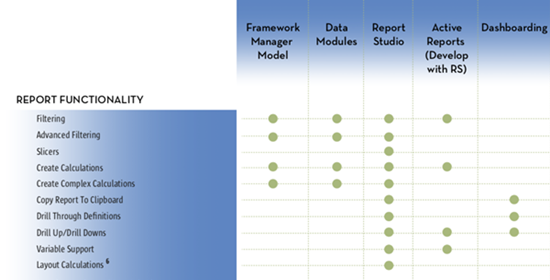
Visual reference guide of Cognos tools along with 60-plus capabilities.

Read about the unsung hero of successful BI: documentation.

Step-by-step demo showing how to create a Tableau worksheet leveraging a group.

Get the pros and cons of hierarchies in IBM Planning Analytics.

Learn how to swap out a reporting database for Tableau’s default extracts.

Getting over the hitches of the 7 built-in dashboard starters.

Take these into account when determining which tools are best suited to the task at hand.